
The price continues to move down, but the USDJPY chart shows signs that the downward momentum is likely to end soon.
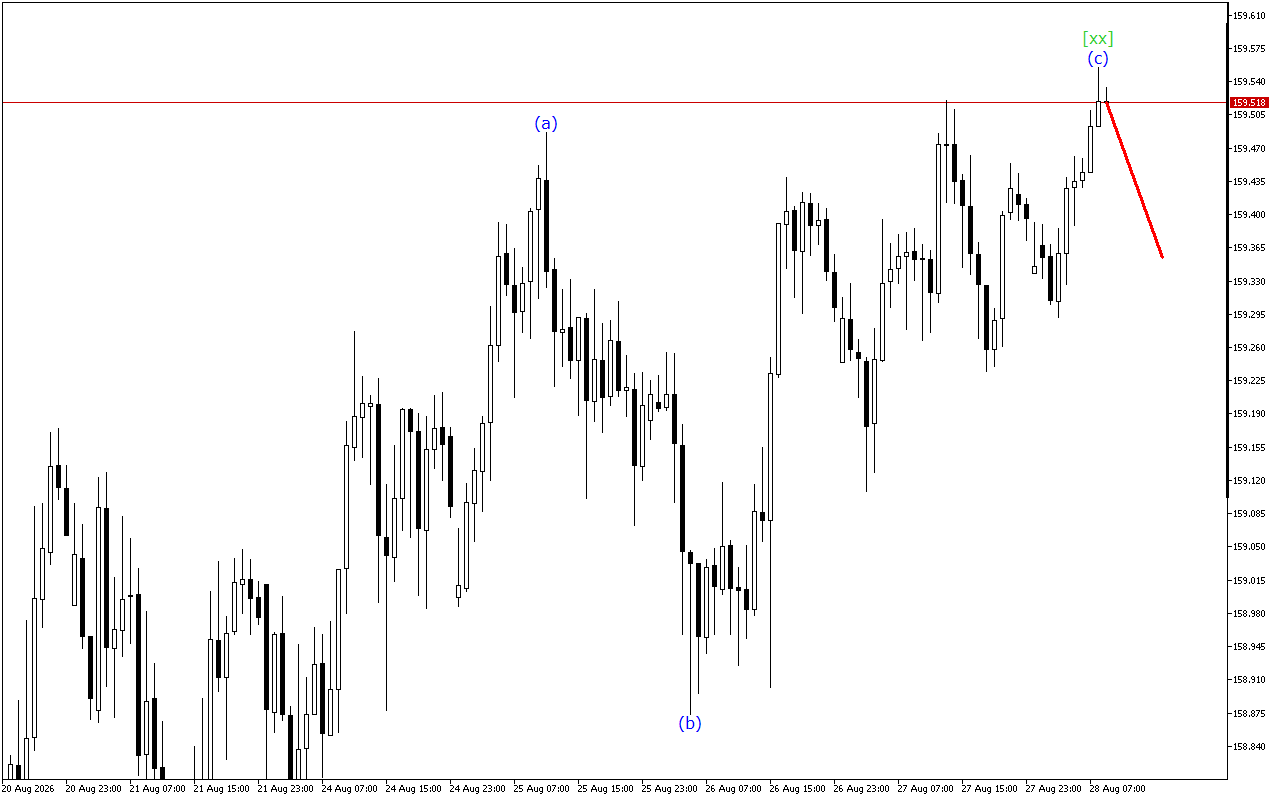
The medium-term movement vector of USDJPY indicates the formation of a Triple Three wave structure. Now the formation of the wave [xx] is completed and the beginning of an upward movement within the wave [z] is expected.
According to a lower-degree wave structure, USDJPY is now moving within the ABC zigzag. In this case, the price is likely completing the formation of the wave (c).
To summarize, at the moment the USDJPY chart is maintaining a downward movement vector. However, the corrective wave is in the final stage of formation.
In this situation, long positions are prioritized.
Alternative scenario
Short positions will be relevant after the breakout of the current wave start level
USDJPY H1: Wave Analysis for the American Session on 8.5.2026

Related Posts
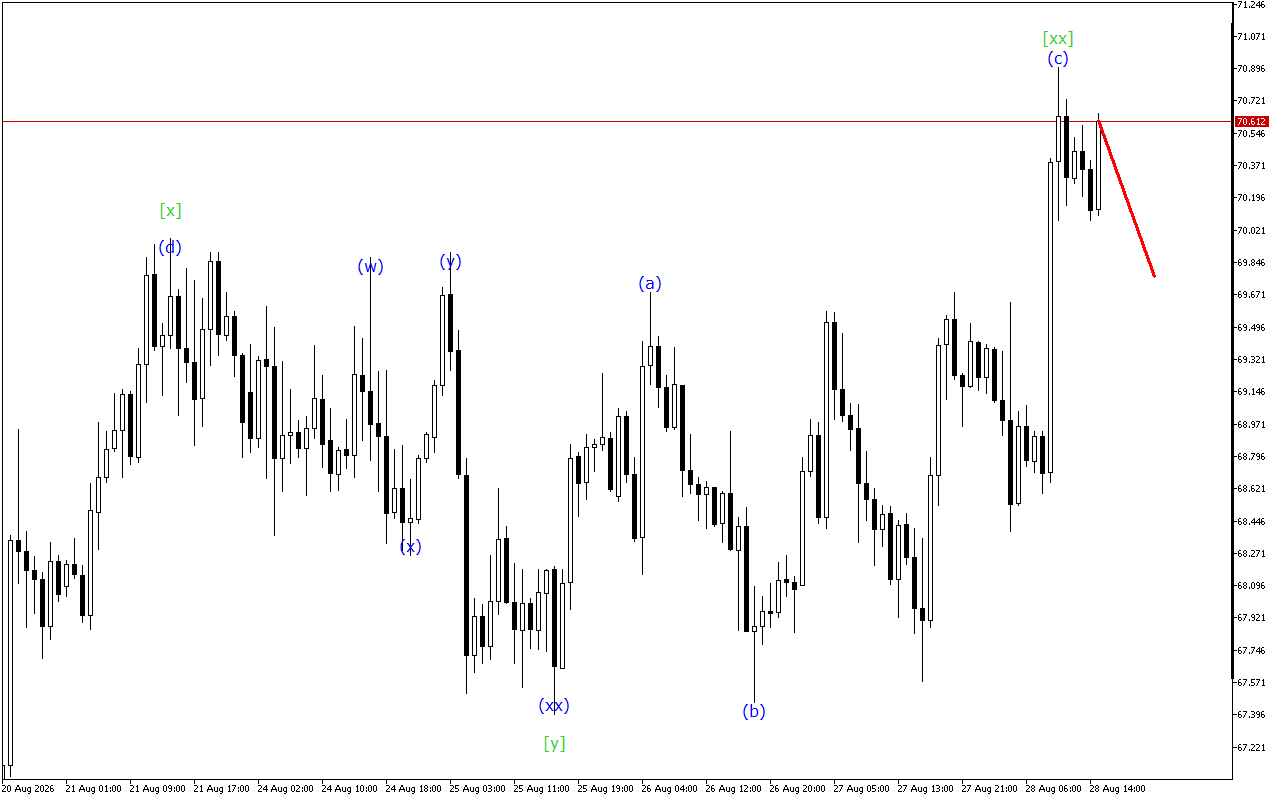
XAGUSD H1: Wave Analysis for the American Session on 28.8.2026
The XAGUSD chart shows signals for the end of the upward movement phase.The current dynamics of the movement indicate the formation of a triple three. At the moment, the wave…
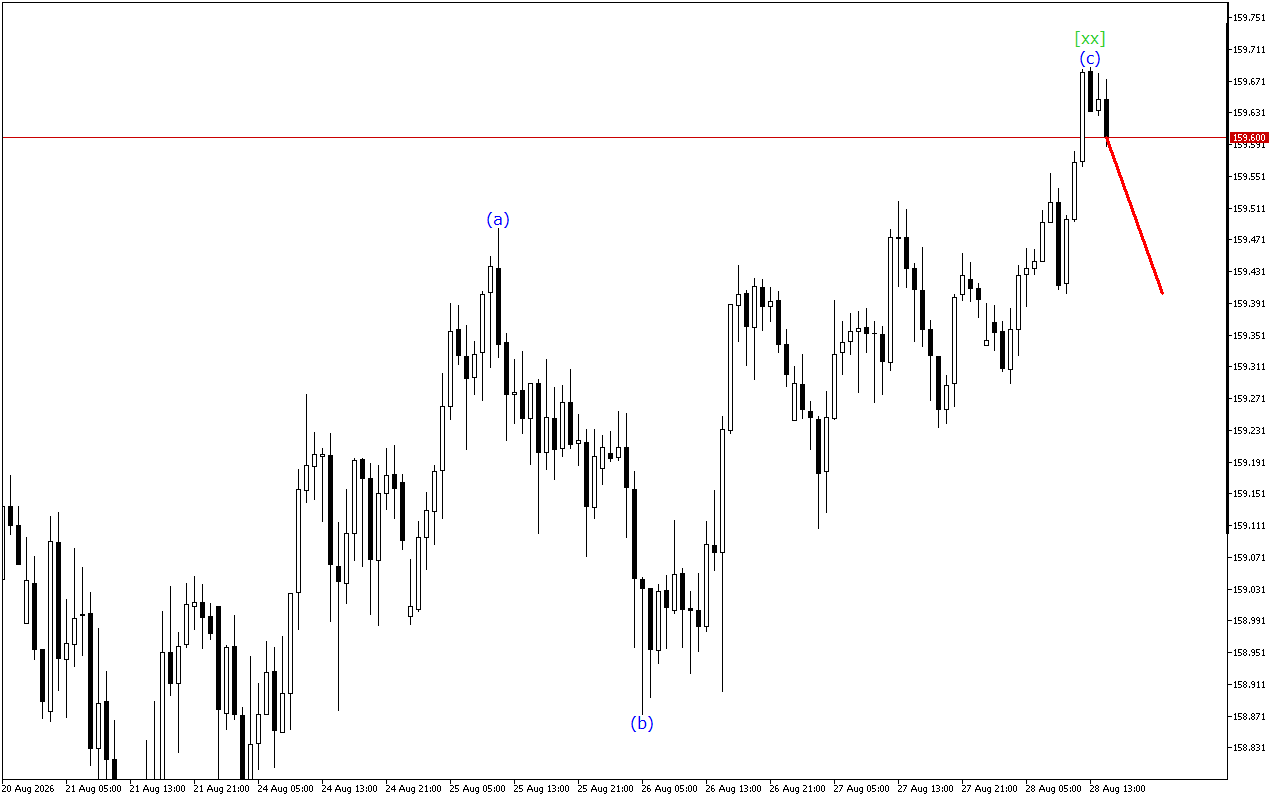
USDJPY H1: Wave Analysis for the American Session on 28.8.2026
The USDJPY chart shows signals for the end of the upward movement phase.The current dynamics of the movement indicate the formation of a triple three. At the moment, the wave…