

Despite the decline, there are signals on the USDJPY chart indicating a possible upcoming change in direction.
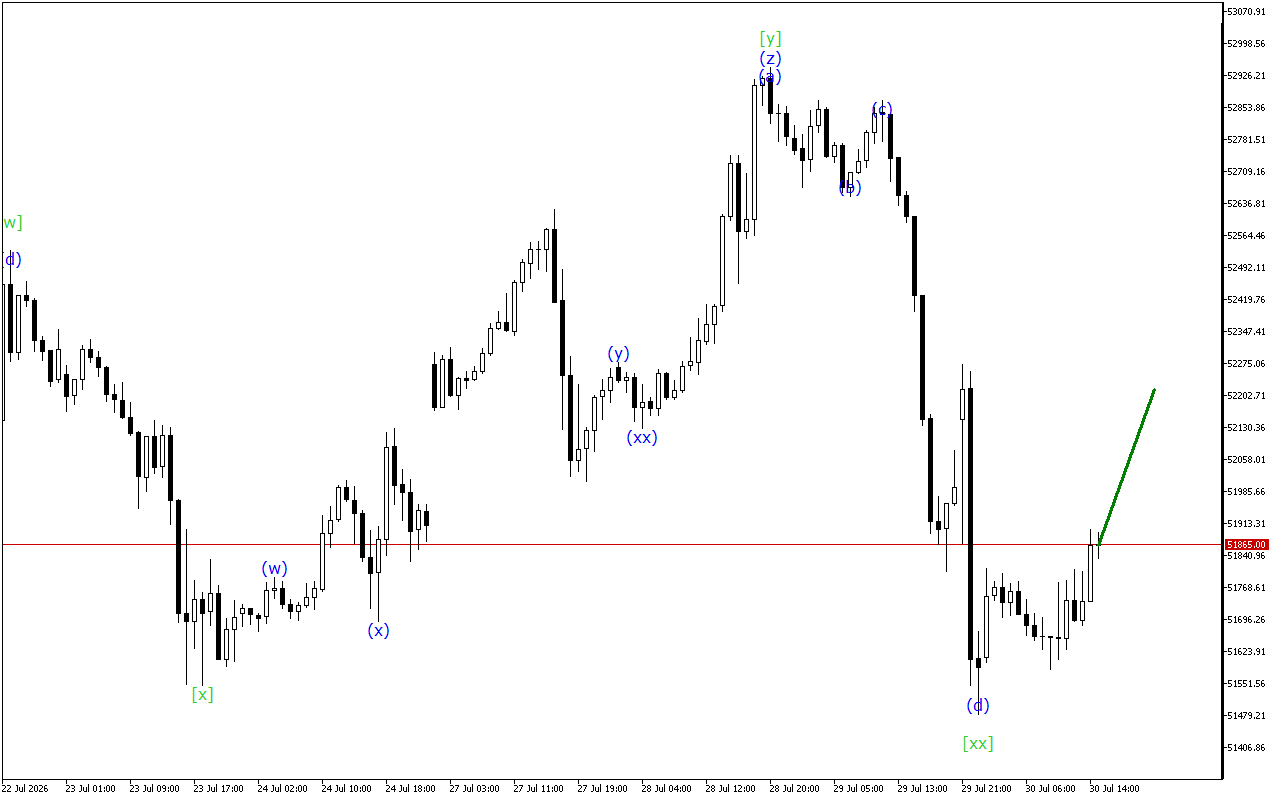
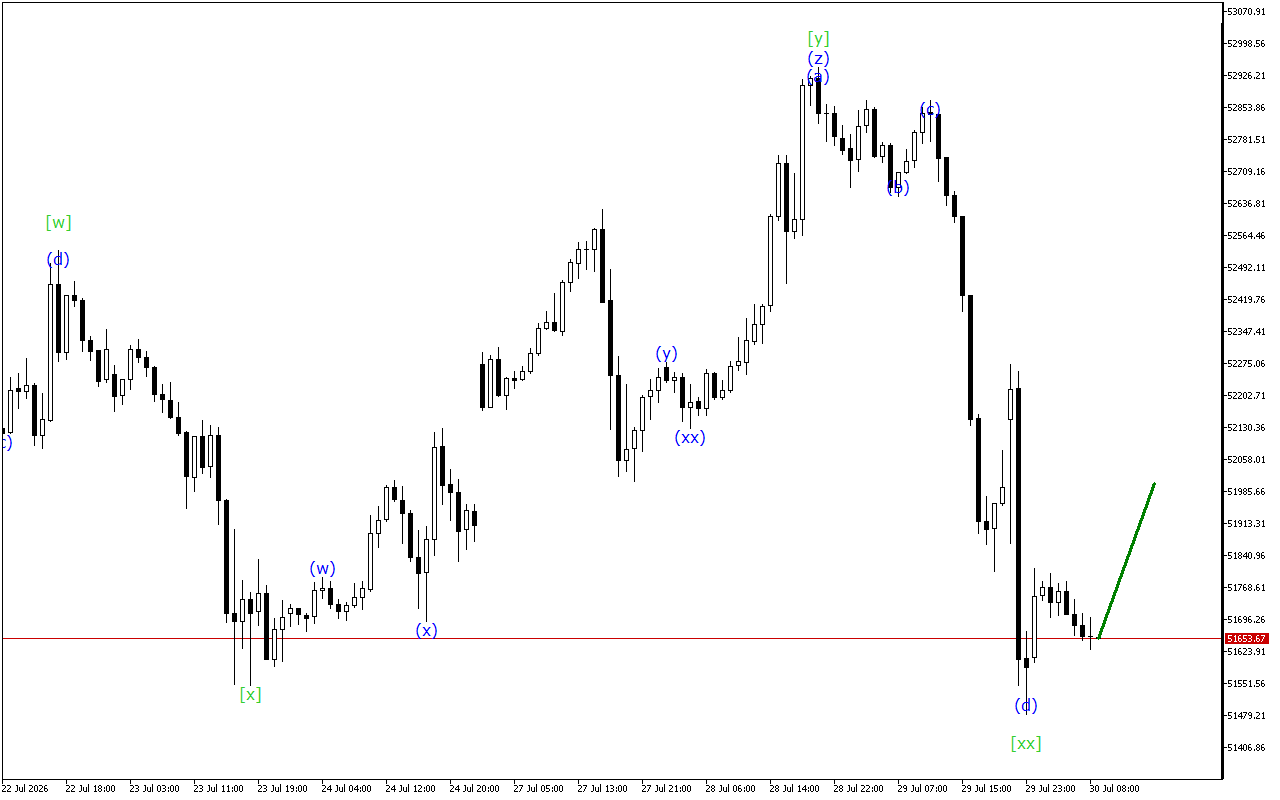
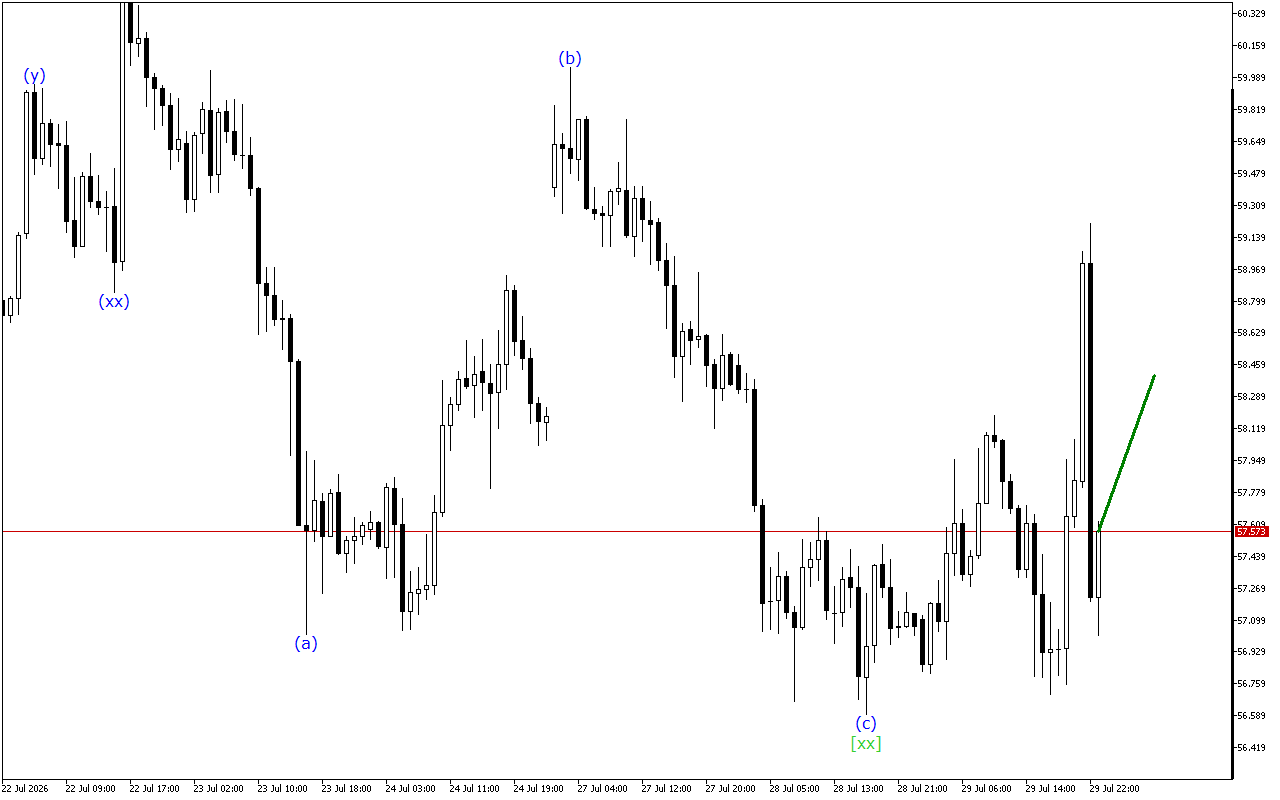
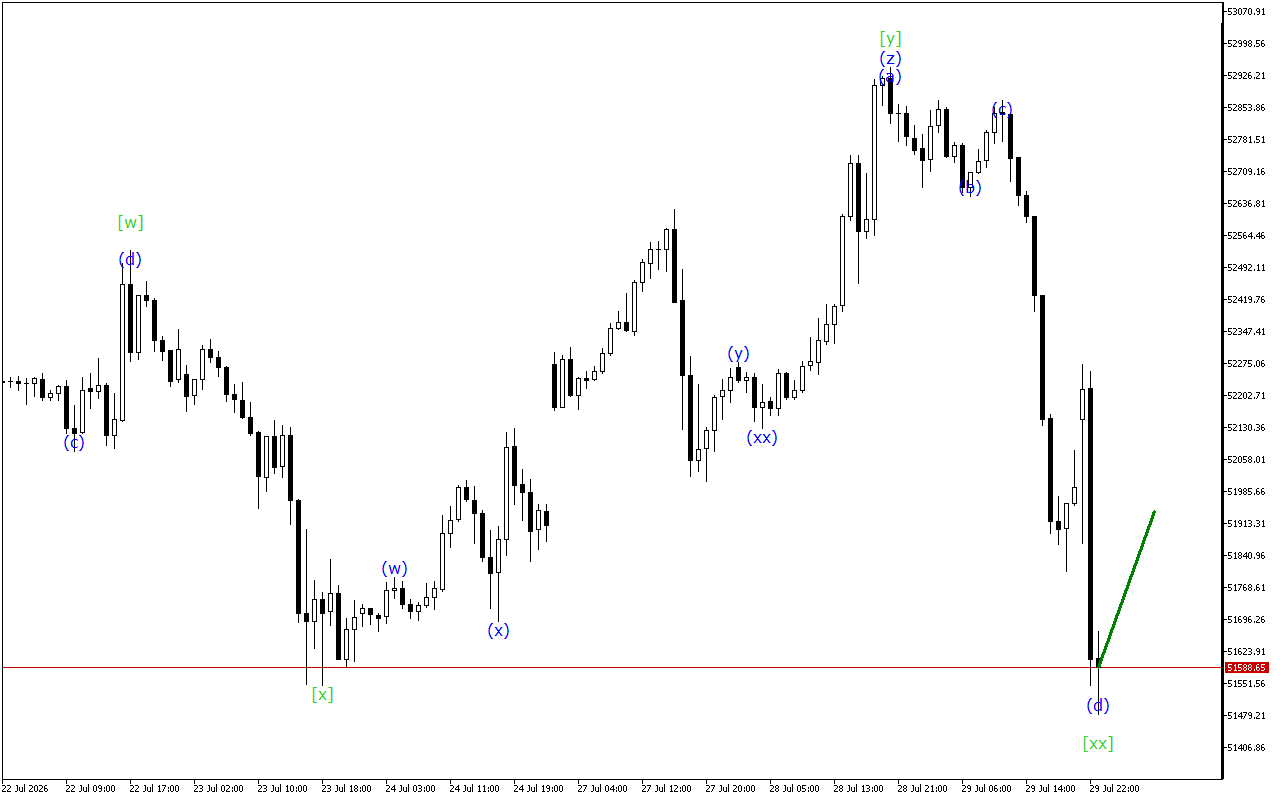
The medium-term movement vector of USDJPY indicates the formation of a Triple Three wave structure. Now the formation of the wave [xx] is completed and the beginning of an upward movement within the wave [z] is expected.
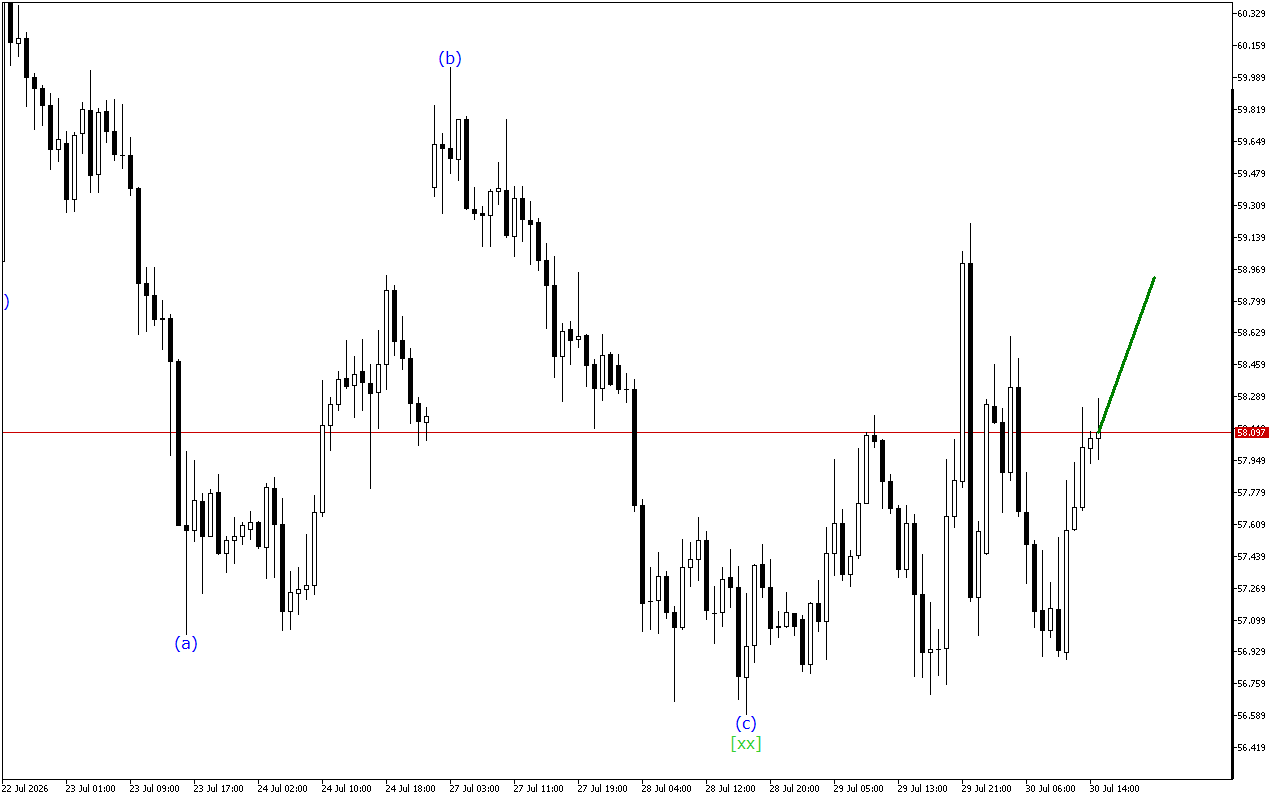
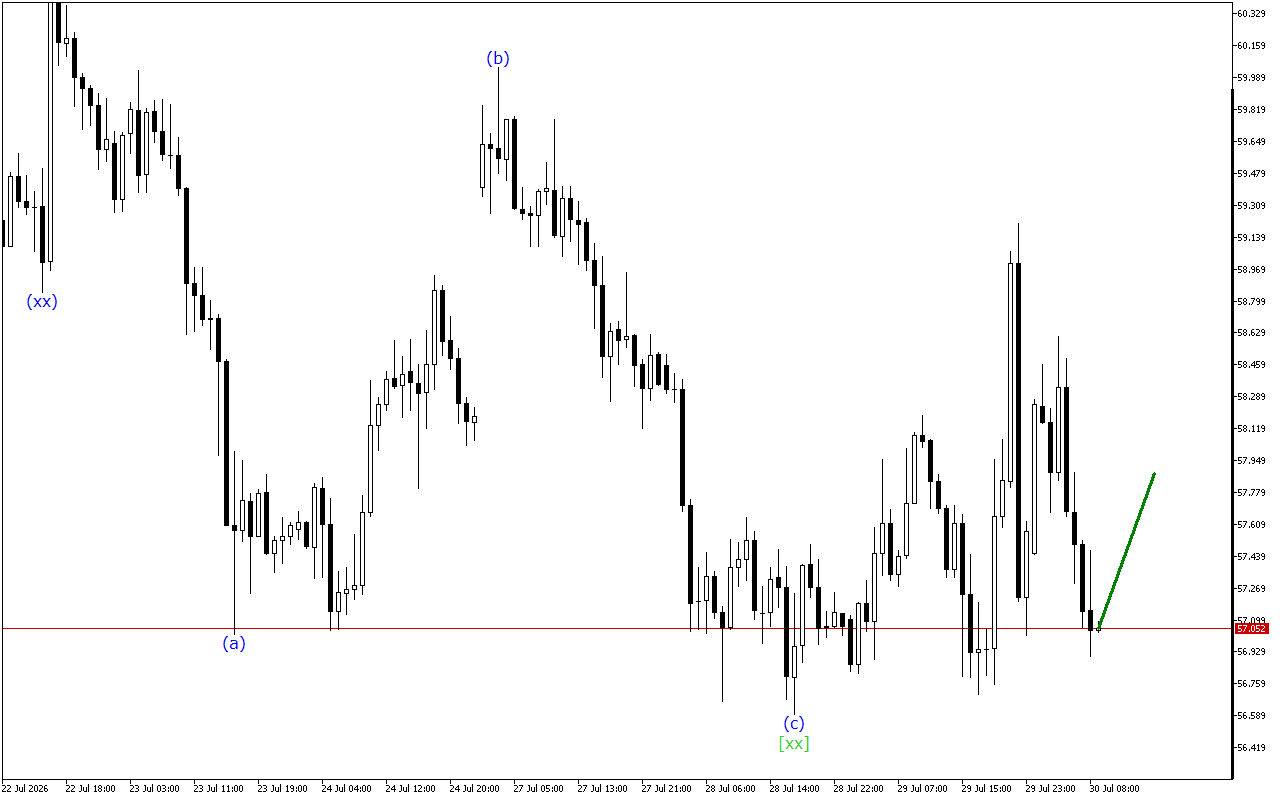
Waves of a lower time-frame form a triple three. The price is currently in the wave (z). When this wave is completed, a more directional price movement is expected.
To summarize, at the moment the USDJPY chart is maintaining a downward movement vector. However, the corrective wave is in the final stage of formation.
In this situation, long positions are prioritized.
USDJPY H1: Wave Analysis for the European Session on 16.9.2025
Related Posts
Dow Jones H1: Wave Analysis for the American Session on 30.7.2026
Despite the decline, there are signals on the Dow Jones chart indicating a possible upcoming change in direction.Dow Jones continues to move within the Triple Three wave structure. Now, apparently,…
XAGUSD H1: Wave Analysis for the American Session on 30.7.2026
Despite the decline, there are signals on the XAGUSD chart indicating a possible upcoming change in direction.XAGUSD continues to move within the Triple Three wave structure. Now, apparently, the formation…