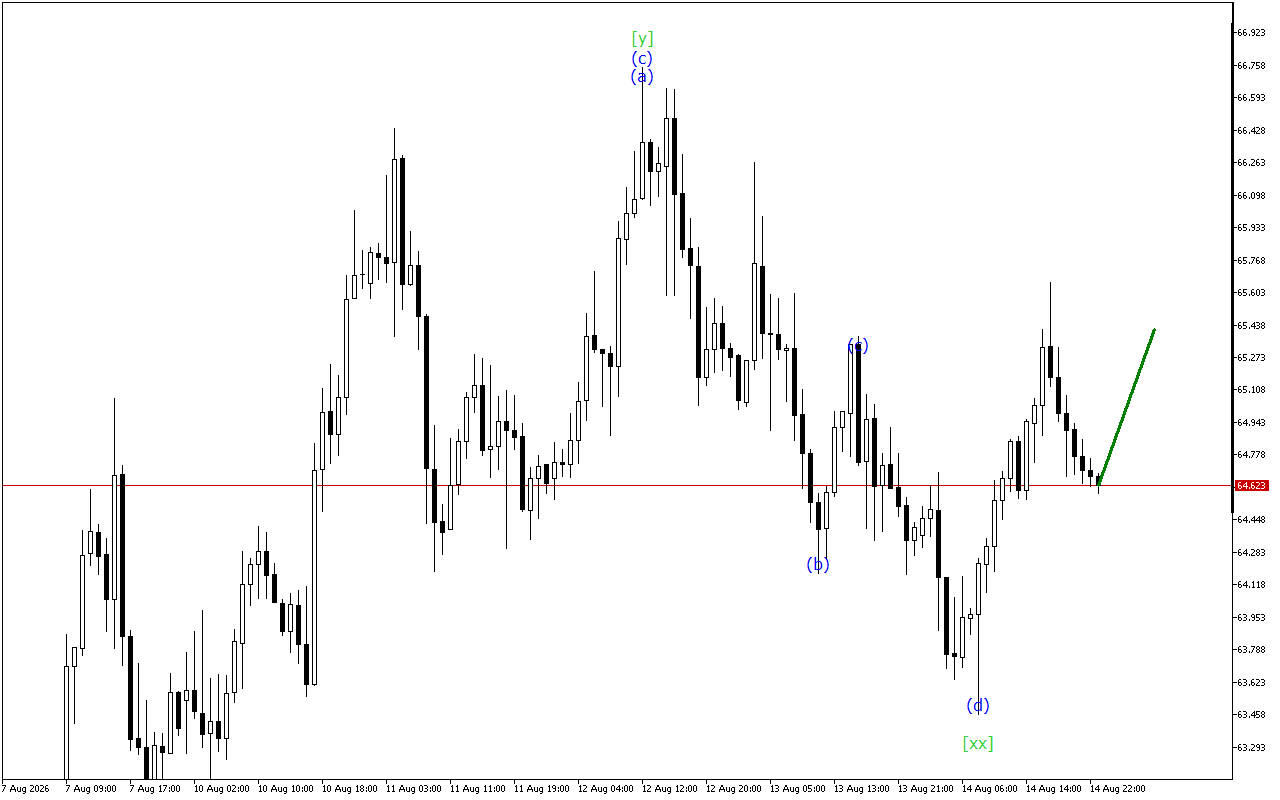
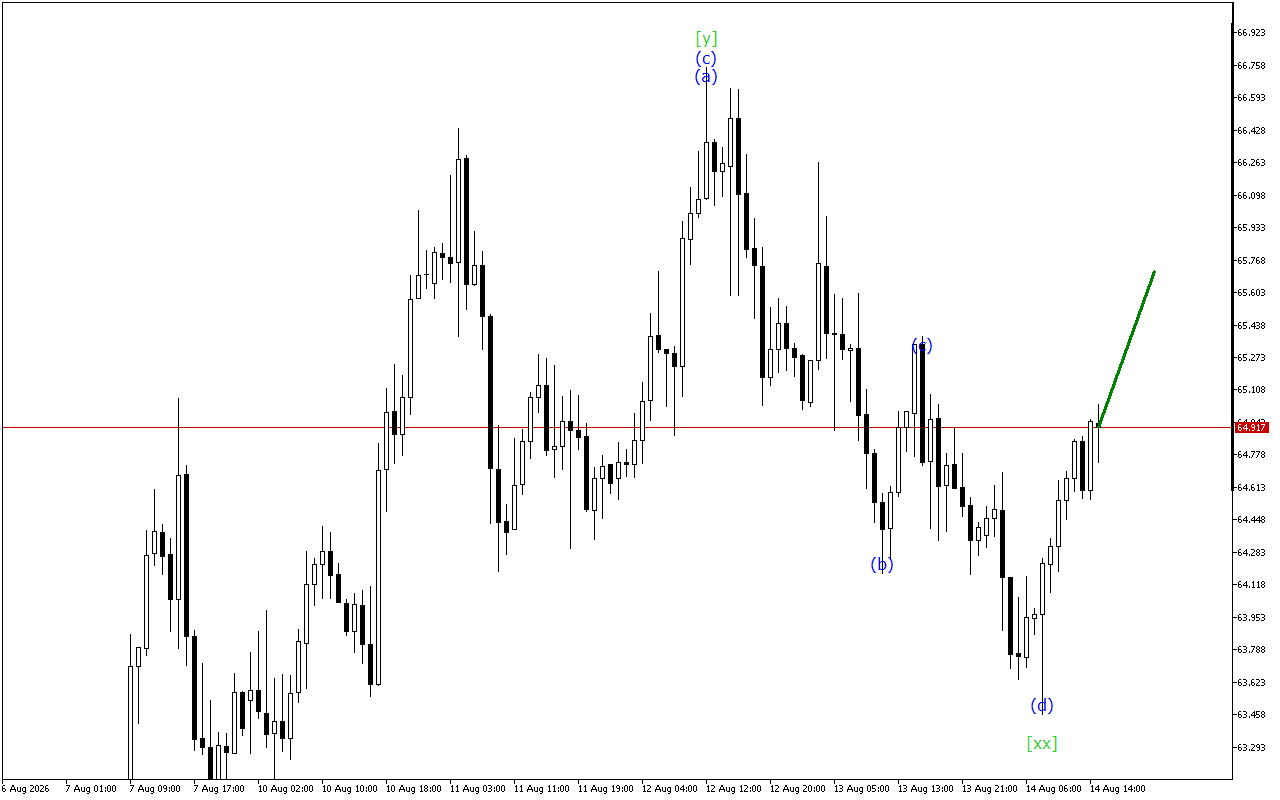
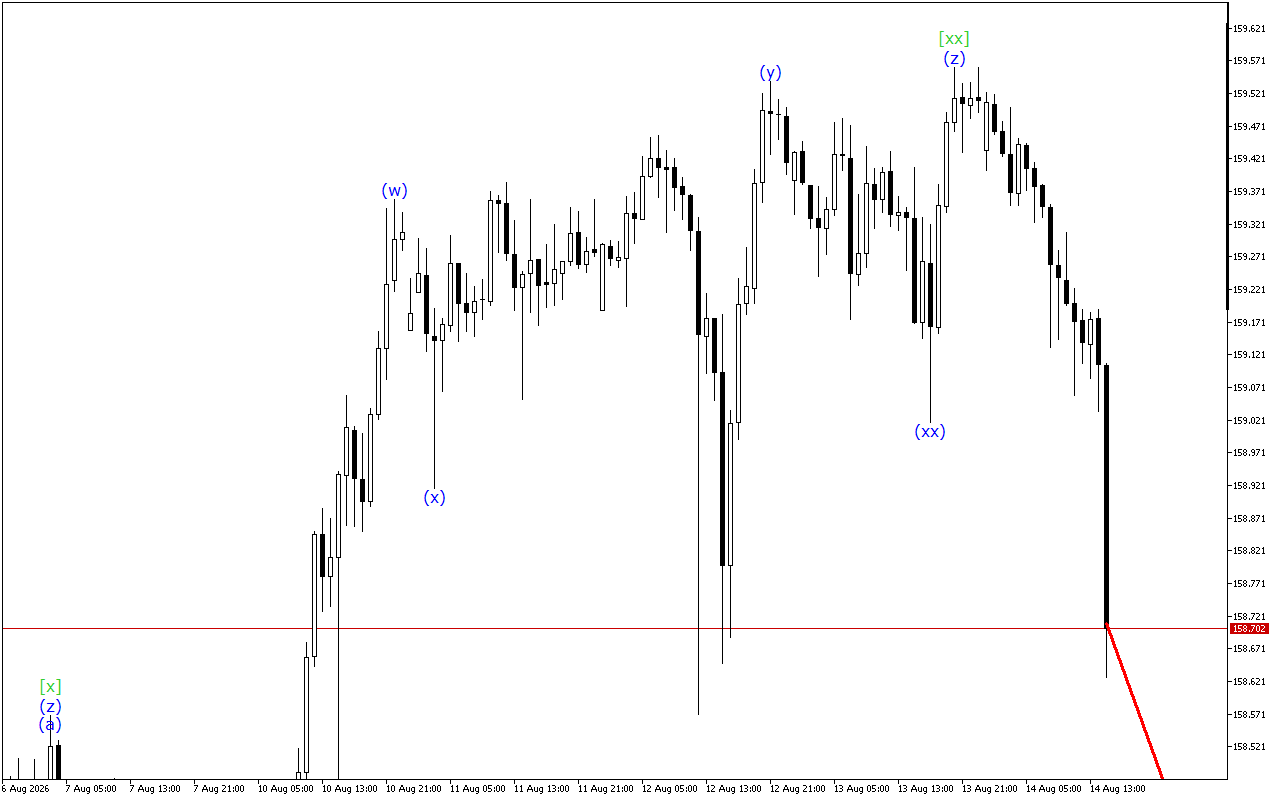
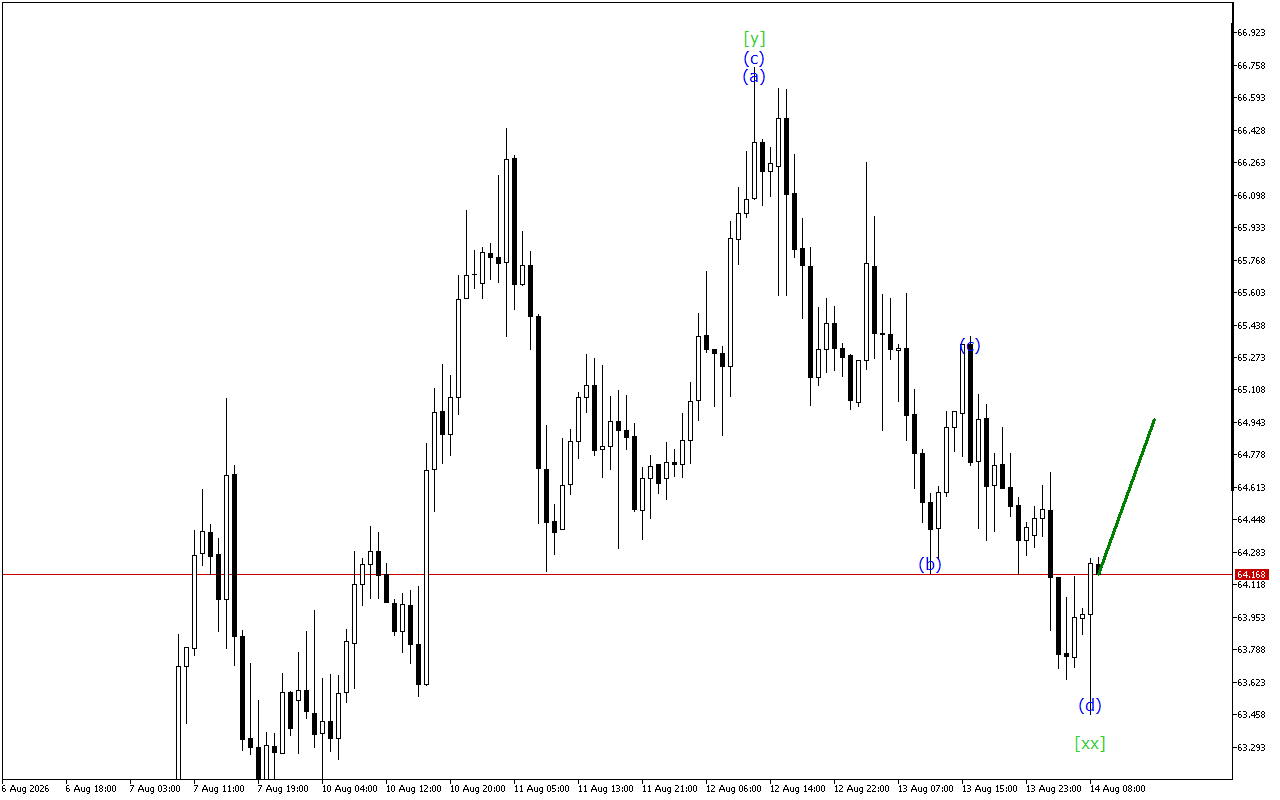
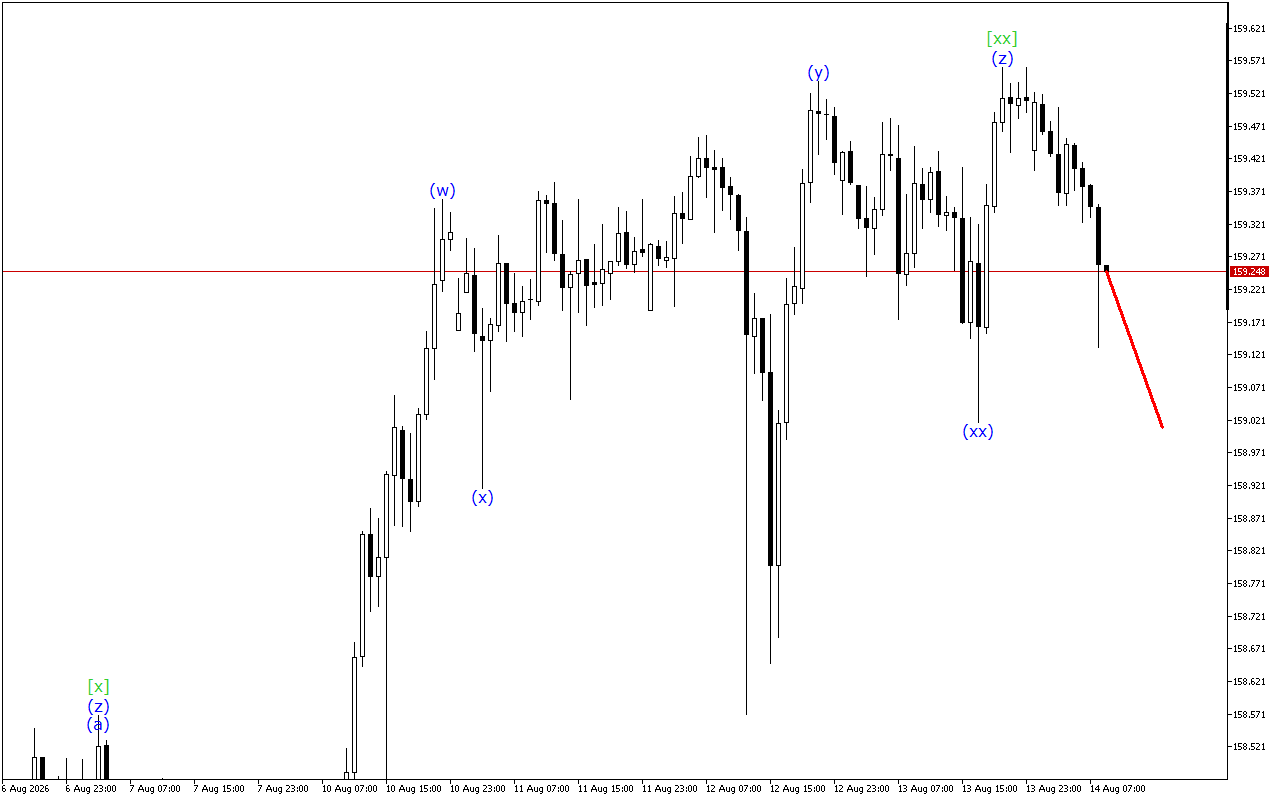
The Stellar chart shows signals for the end of the upward movement phase.
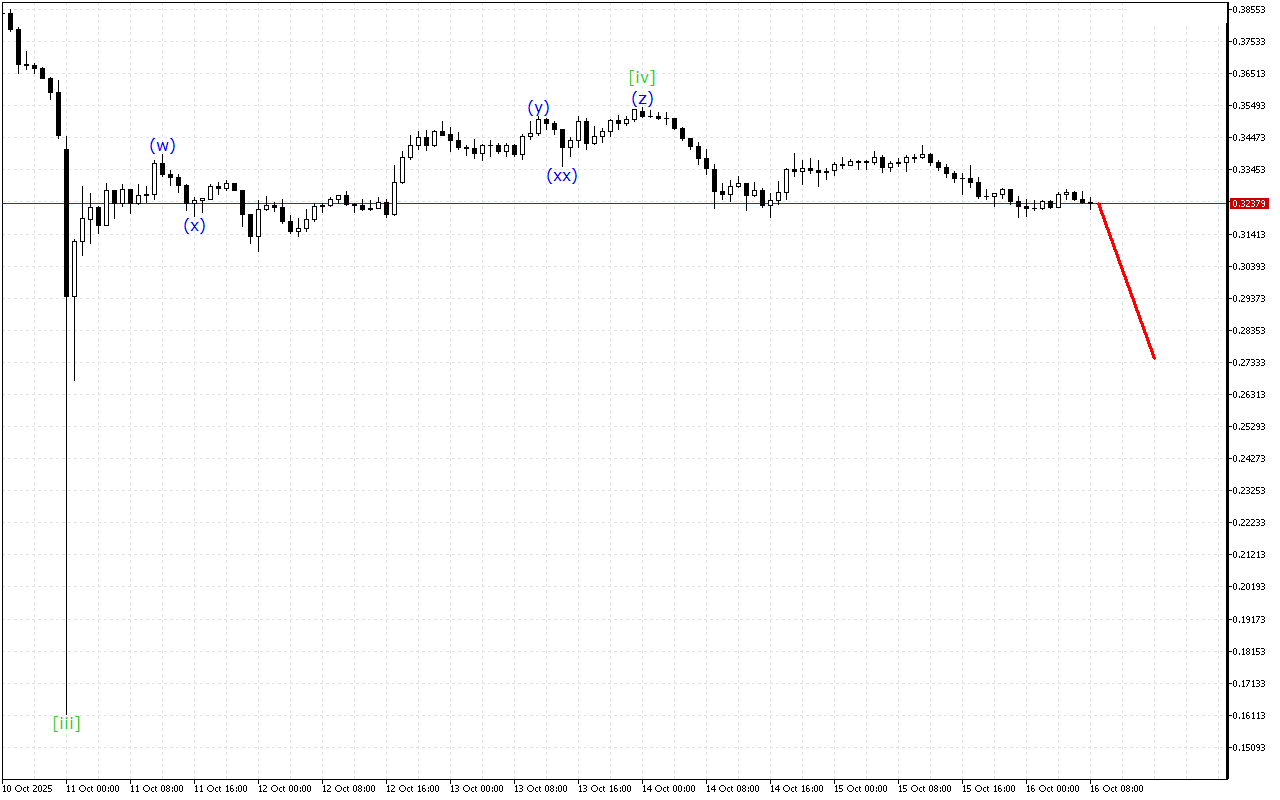
At a higher time interval, the formation of an incomplete downward impulse is observed. Currently, within this structure, a corrective wave [iv] has been formed. It should be followed with a downward impulse wave [v].
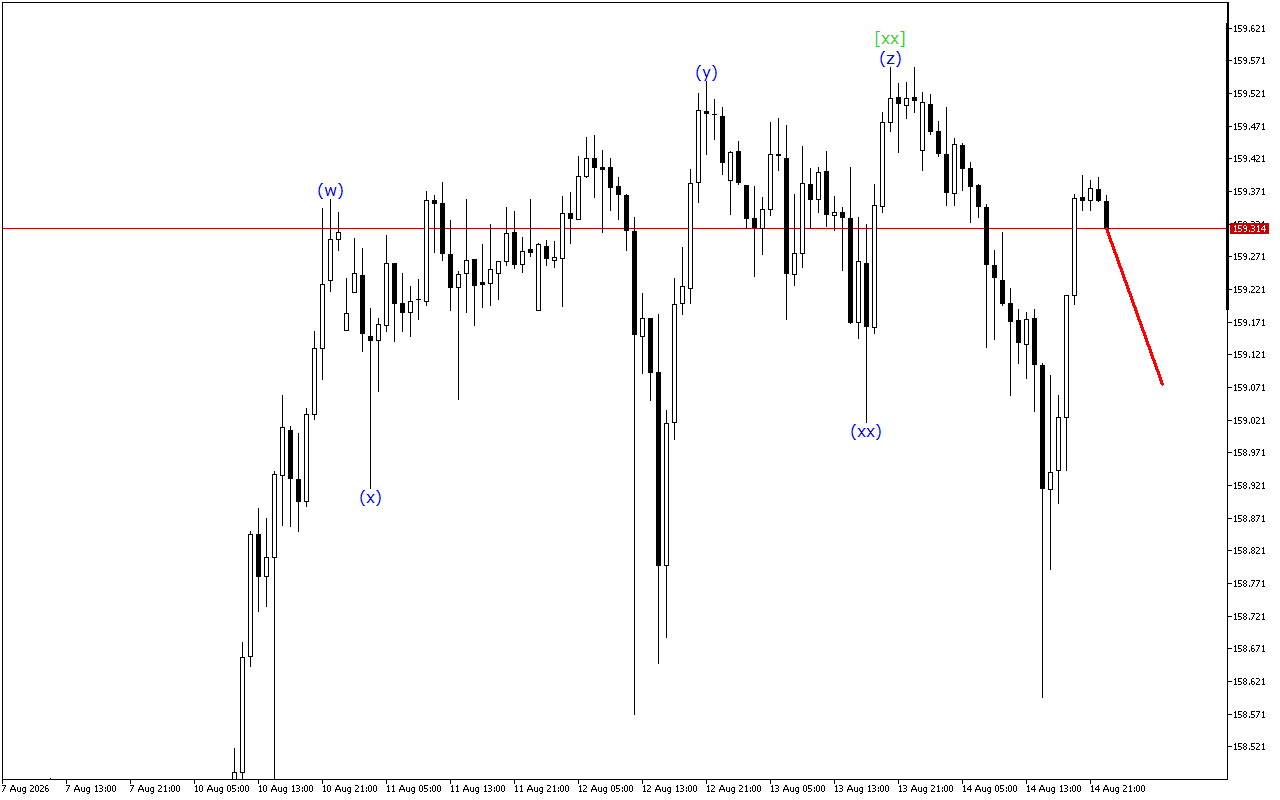
At a lower-degree wave structure, the formation of a triple three is noted. Now the price is in the wave (z), which completes this formation. This wave is expected to end in the near future. After that the current price trend may change.
As a result, the formation of a downward movement continues on the chart. However, a wave structure is almost formed and the price may change the direction of movement.
In this situation, it should be emphasized that short positions remain preferable.
The Stellar chart shows signals for the end of the upward movement phase.
At a higher time interval, the formation of an incomplete downward impulse is observed. Currently, within this structure, a corrective wave [iv] has been formed. It should be followed with a downward impulse wave [v].
At a lower-degree wave structure, the formation of a triple three is noted. Now the price is in the wave (z), which completes this formation. This wave is expected to end in the near future. After that the current price trend may change.
As a result, the formation of a downward movement continues on the chart. However, a wave structure is almost formed and the price may change the direction of movement.
In this situation, it should be emphasized that short positions remain preferable.
The Stellar chart shows signals for the end of the upward movement phase.
At a higher time interval, the formation of an incomplete downward impulse is observed. Currently, within this structure, a corrective wave [iv] has been formed. It should be followed with a downward impulse wave [v].
At a lower-degree wave structure, the formation of a triple three is noted. Now the price is in the wave (z), which completes this formation. This wave is expected to end in the near future. After that the current price trend may change.
As a result, the formation of a downward movement continues on the chart. However, a wave structure is almost formed and the price may change the direction of movement.
In this situation, it should be emphasized that short positions remain preferable.