

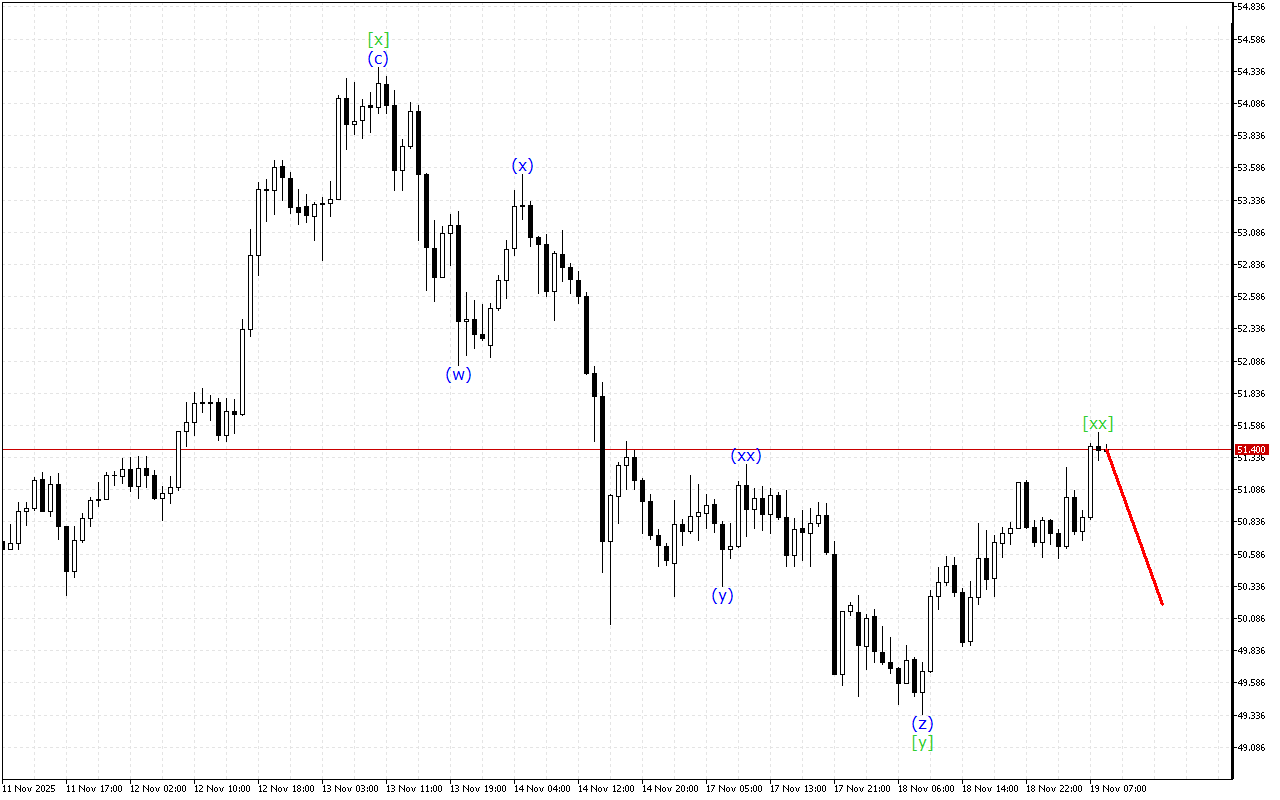
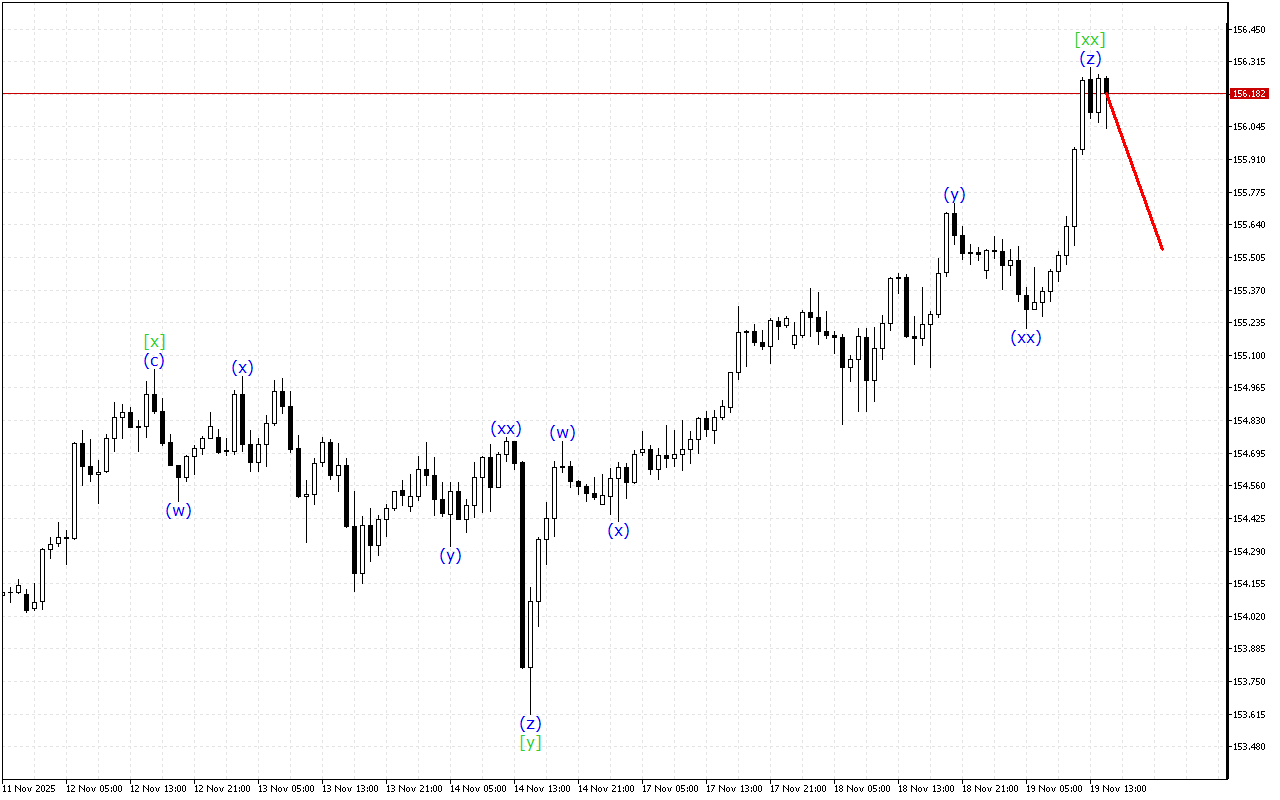
The XAGUSD chart shows signals for the end of the upward movement phase.
The current dynamics of the movement indicate the formation of a triple three. At the moment, the wave [xx] has been formed. After its formation the development of a downward wave [z] is expected.
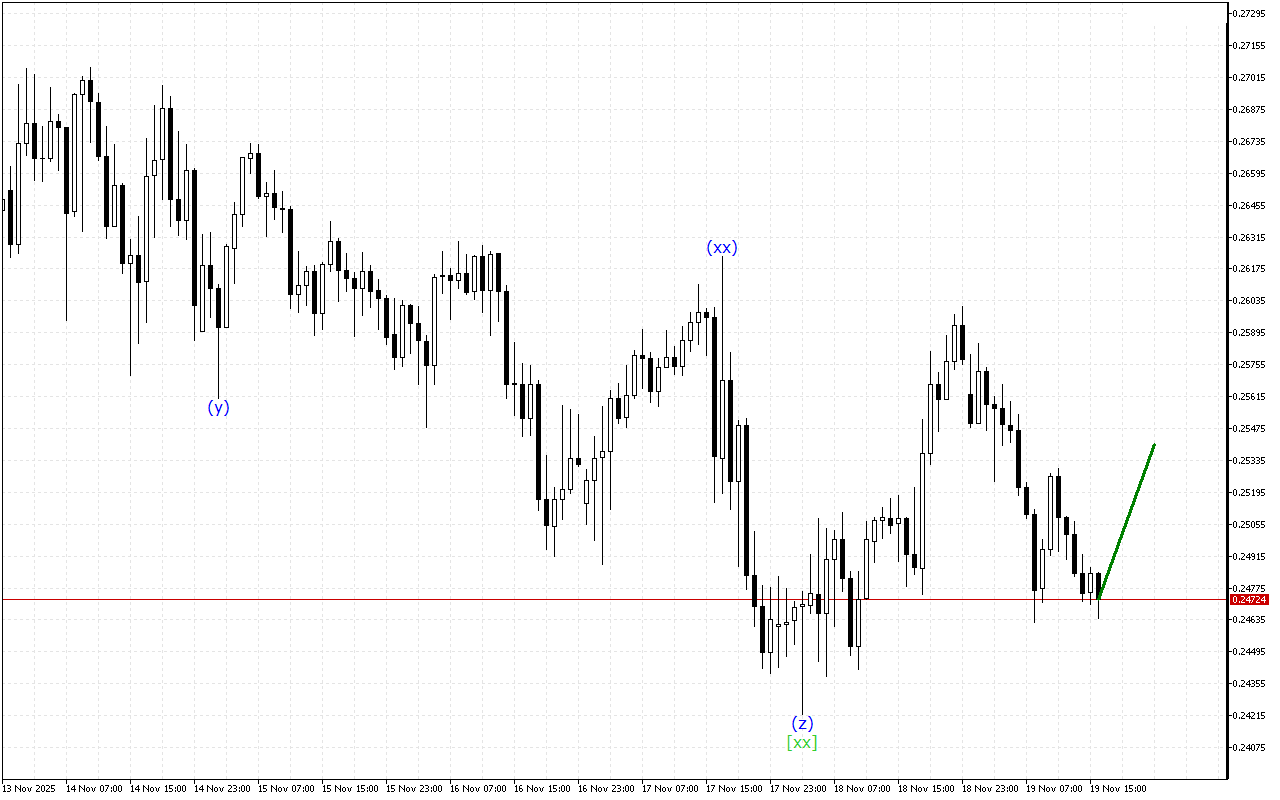
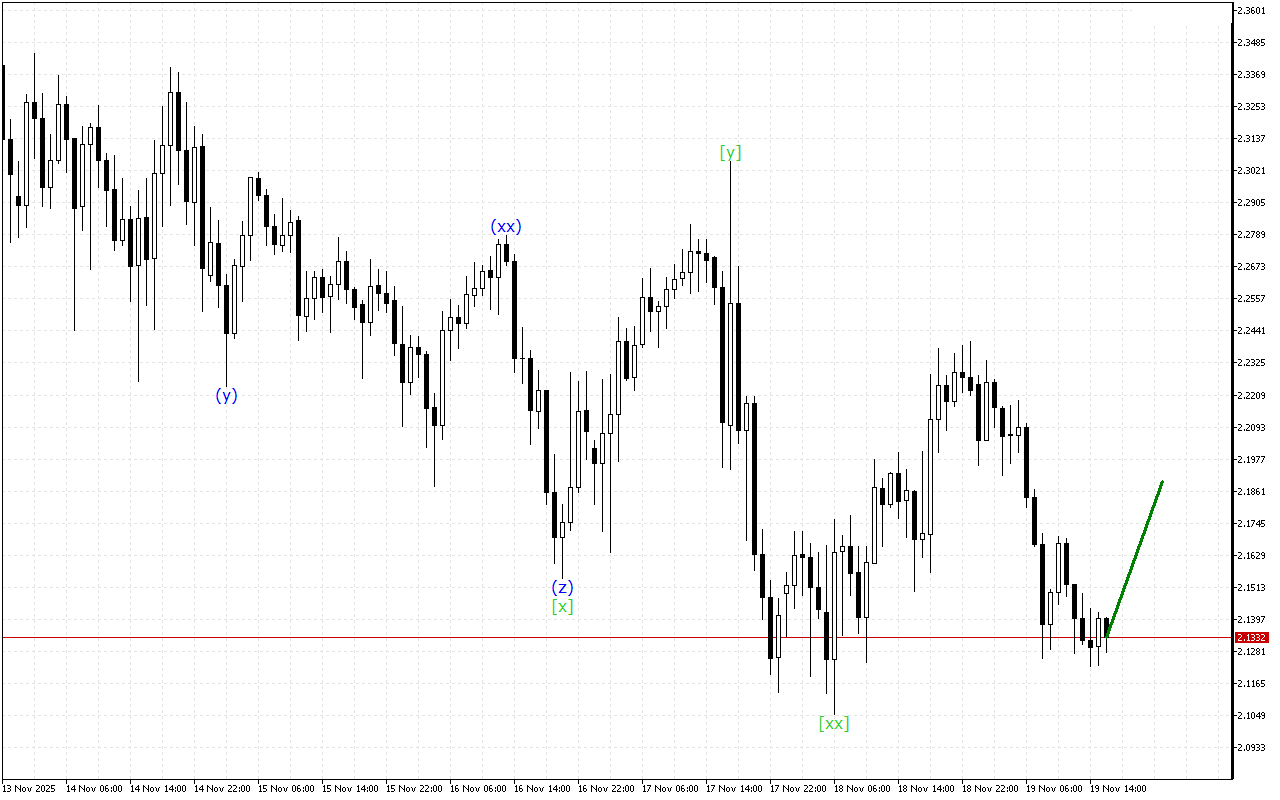
At a lower degree of the wave structure, the development of a triple three, where the formation of wave (z) has completed, is seen.
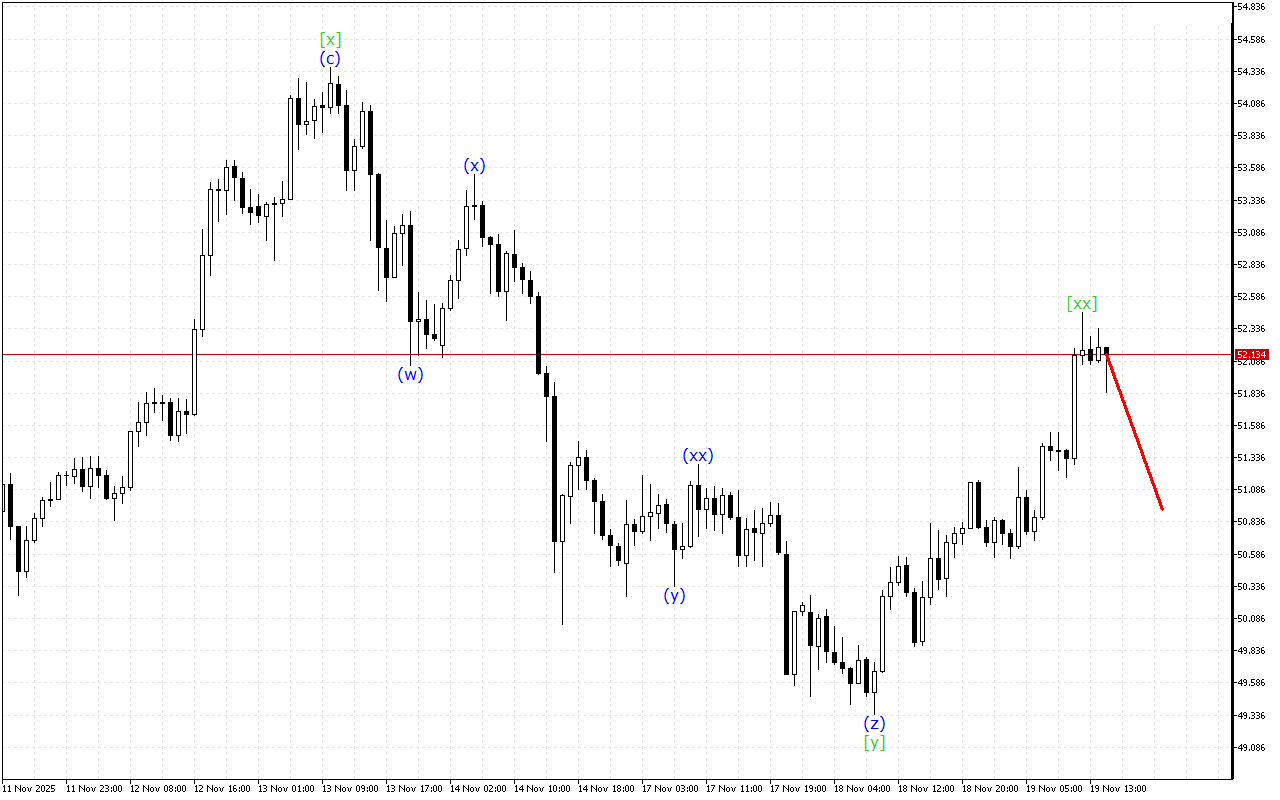
Thus, an upward movement continues to form on the XAGUSD chart, but this impulse is at the final stage of formation so the price may resume a downward movement.
In this case, the emphasis is on short positions that can be considered at current levels.