

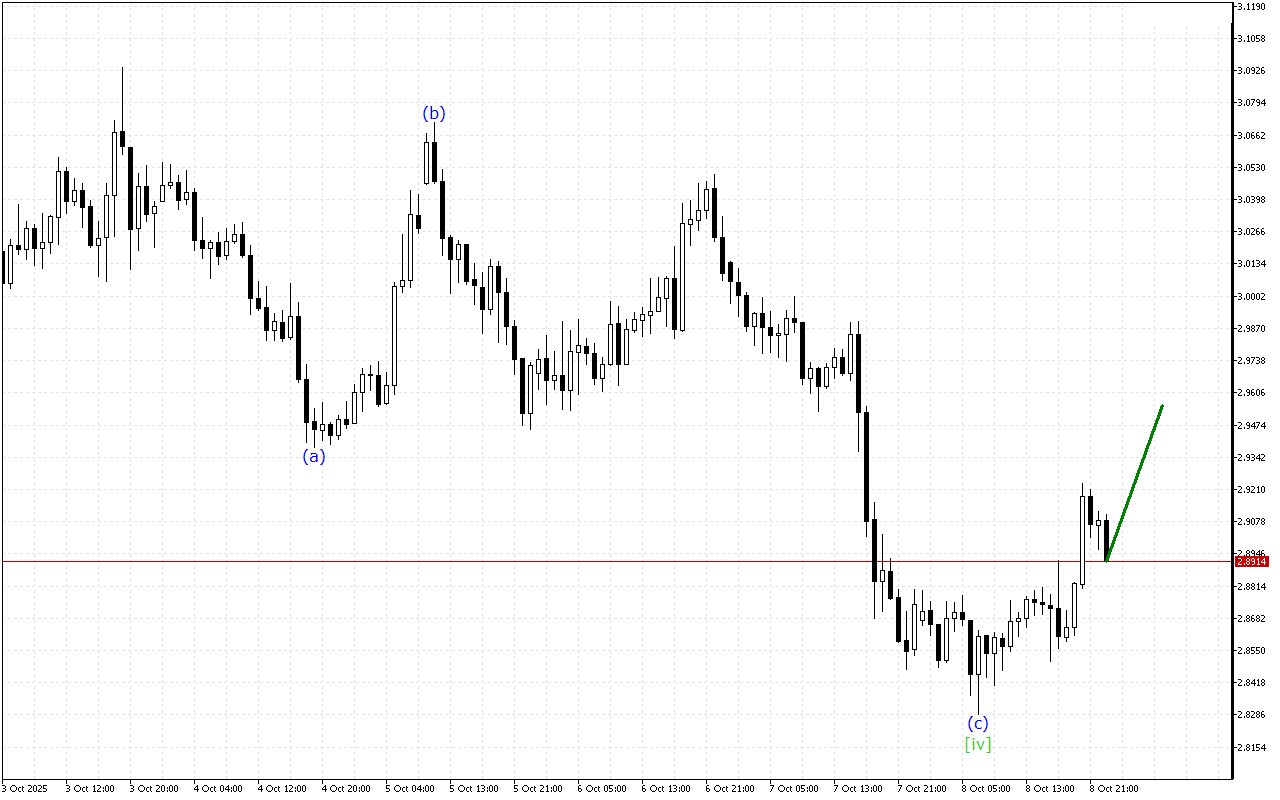
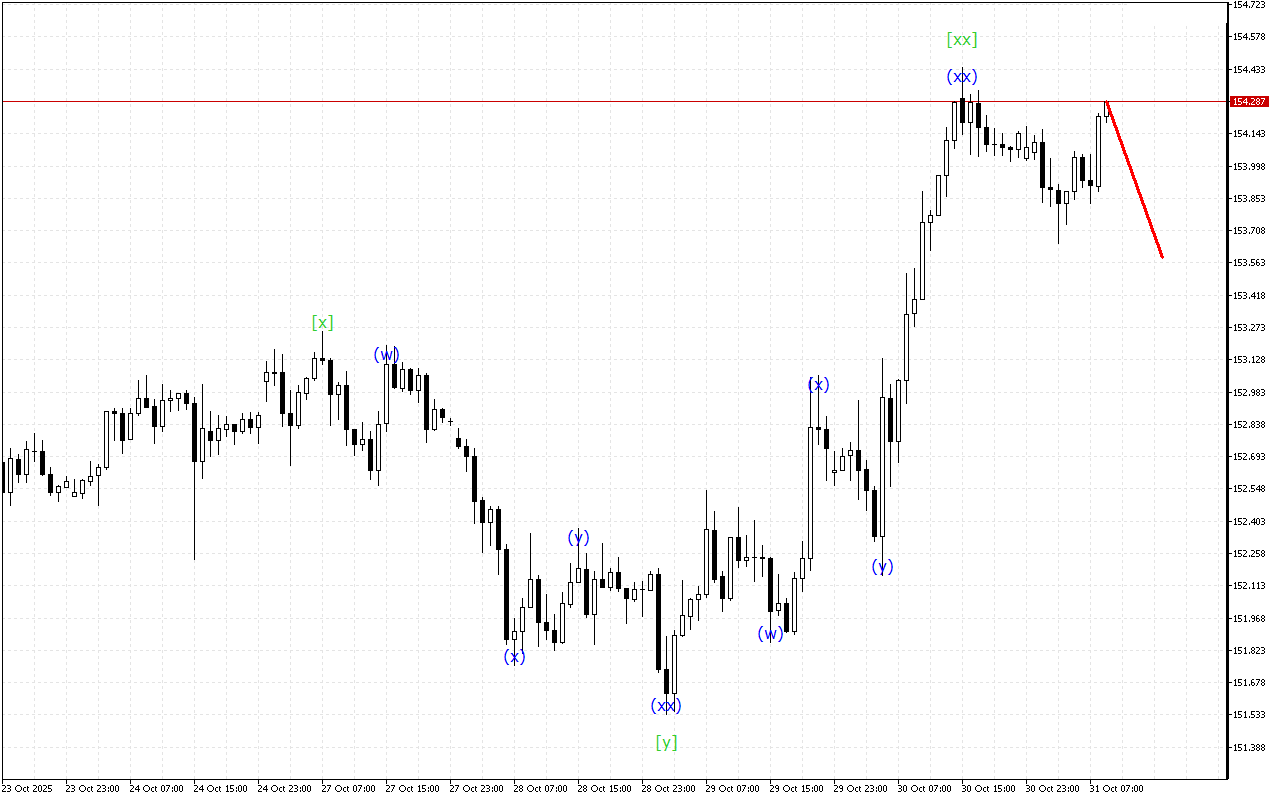
Despite the steady decline in price, the Ripple chart is giving signals about a possible completion of the current bearish momentum.
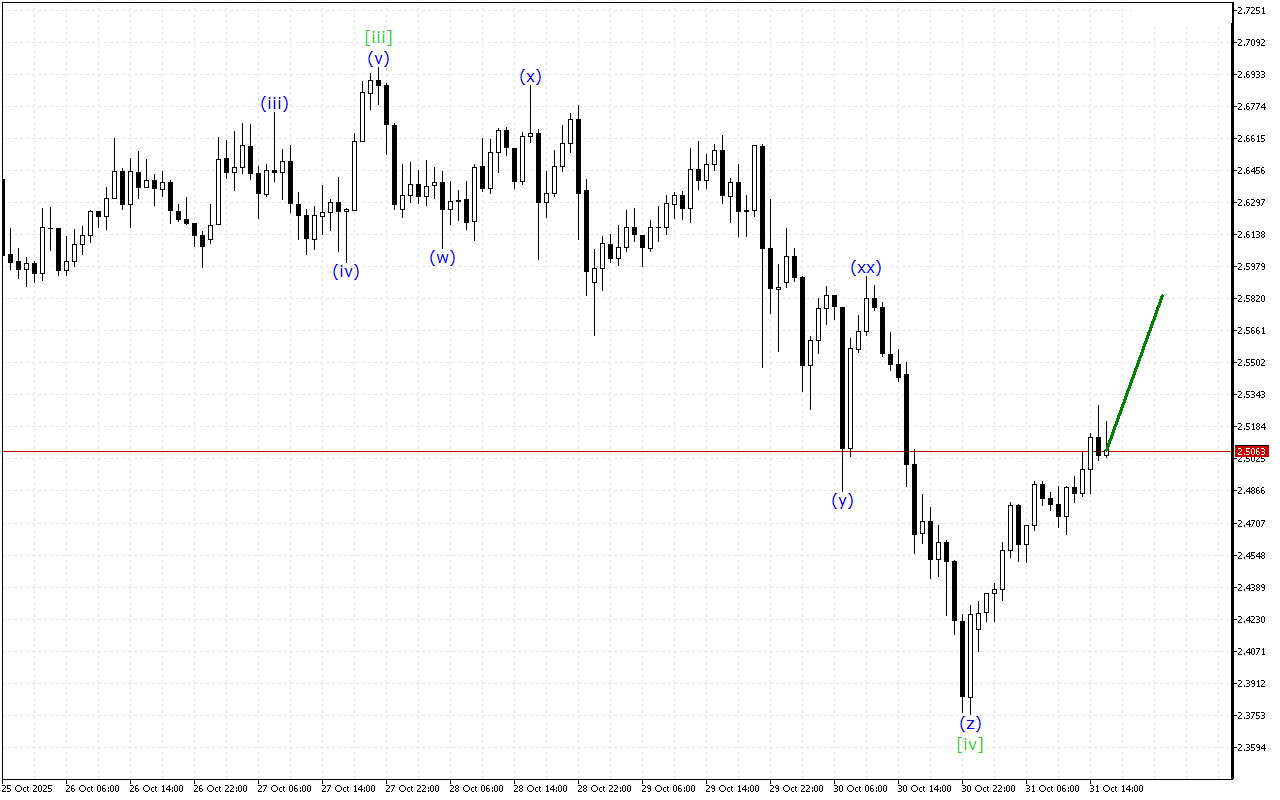
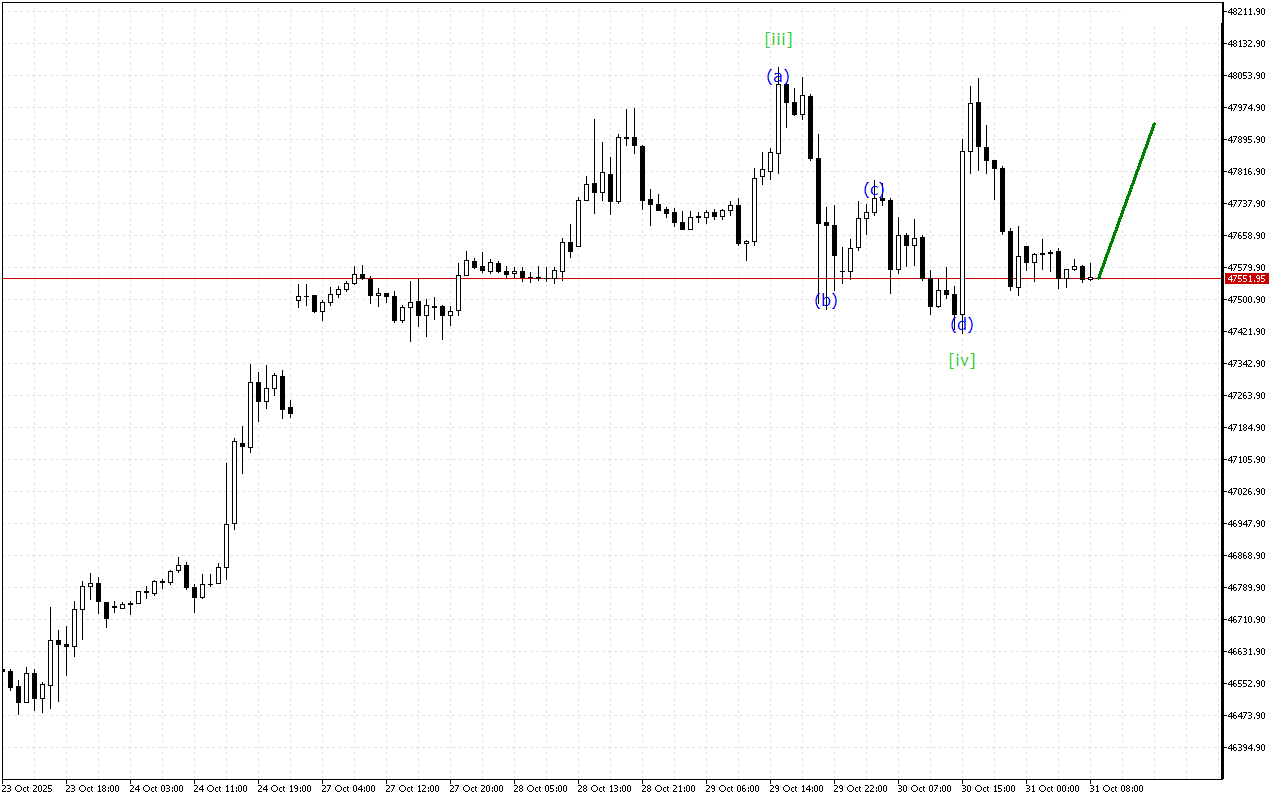
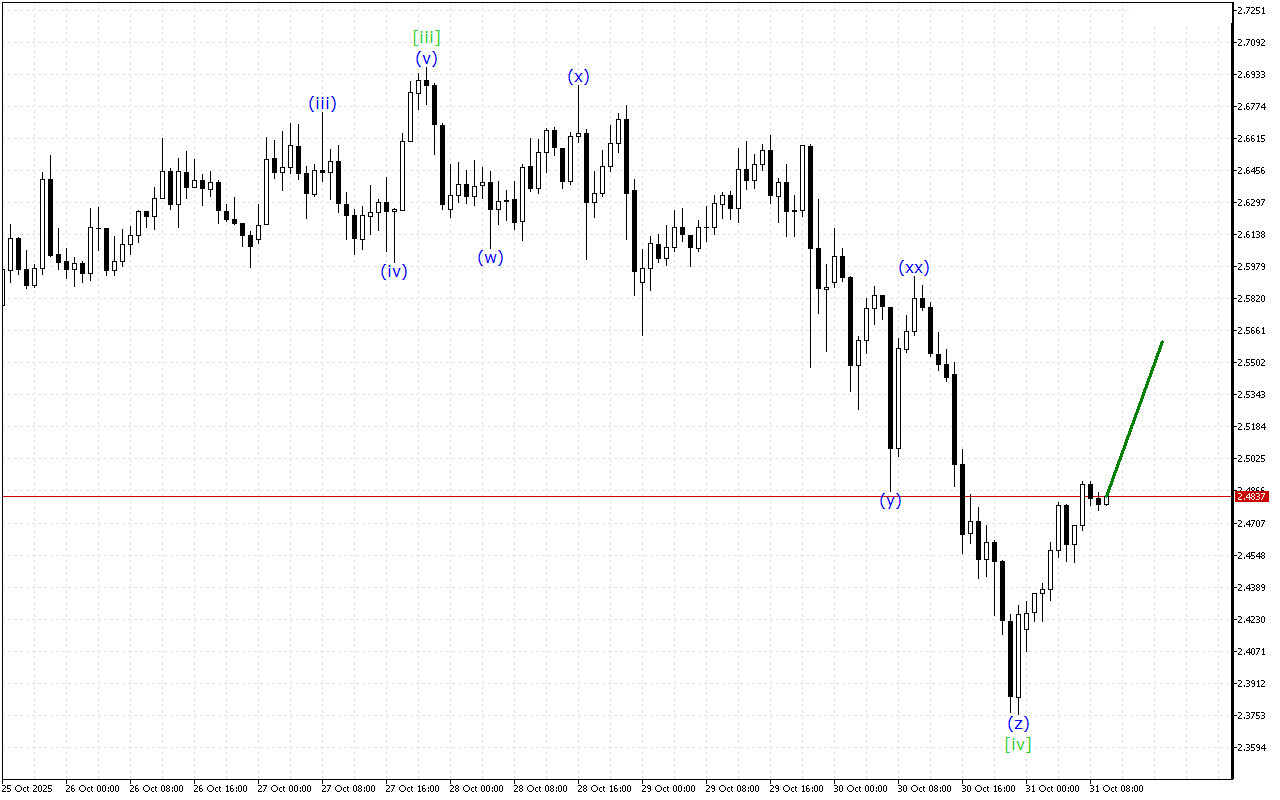
The higher-degree wave structure resembles a rising wedge. Within this five-wave structure, the formation of the wave [iv] is now being completed. As soon as it is formed, the market can begin to grow again.
Lower-degree waves indicate the formation of a downward ABC zigzag. The wave (c) must have already been completed, so the formation of a new wave structure can be expected.
Despite the current downward movement on the Ripple chart, the situation may change soon. The corrective wave is close to completion, which may indicate the possibility of a price reversal.
In the current situation, it is worth paying more attention to long positions.