XAGUSD H1: Wave Analysis for the American Session on 11.9.2025
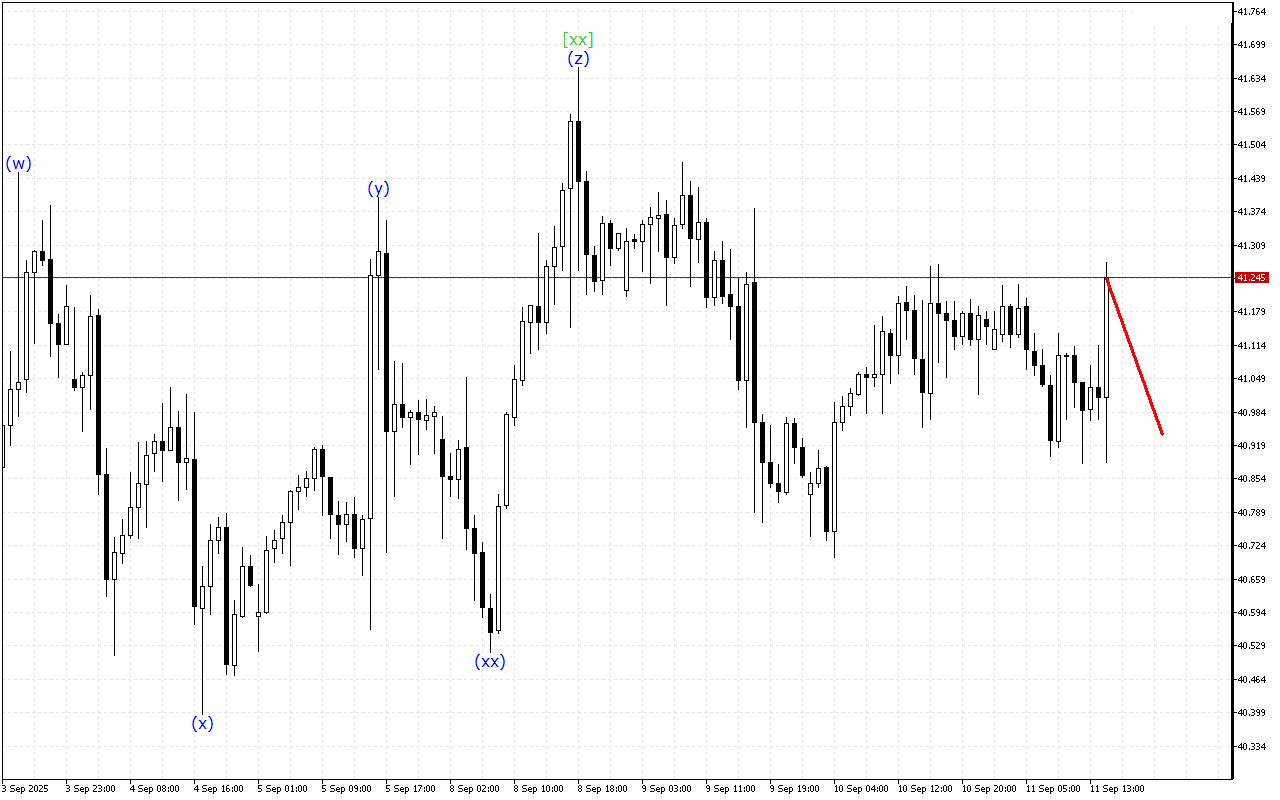
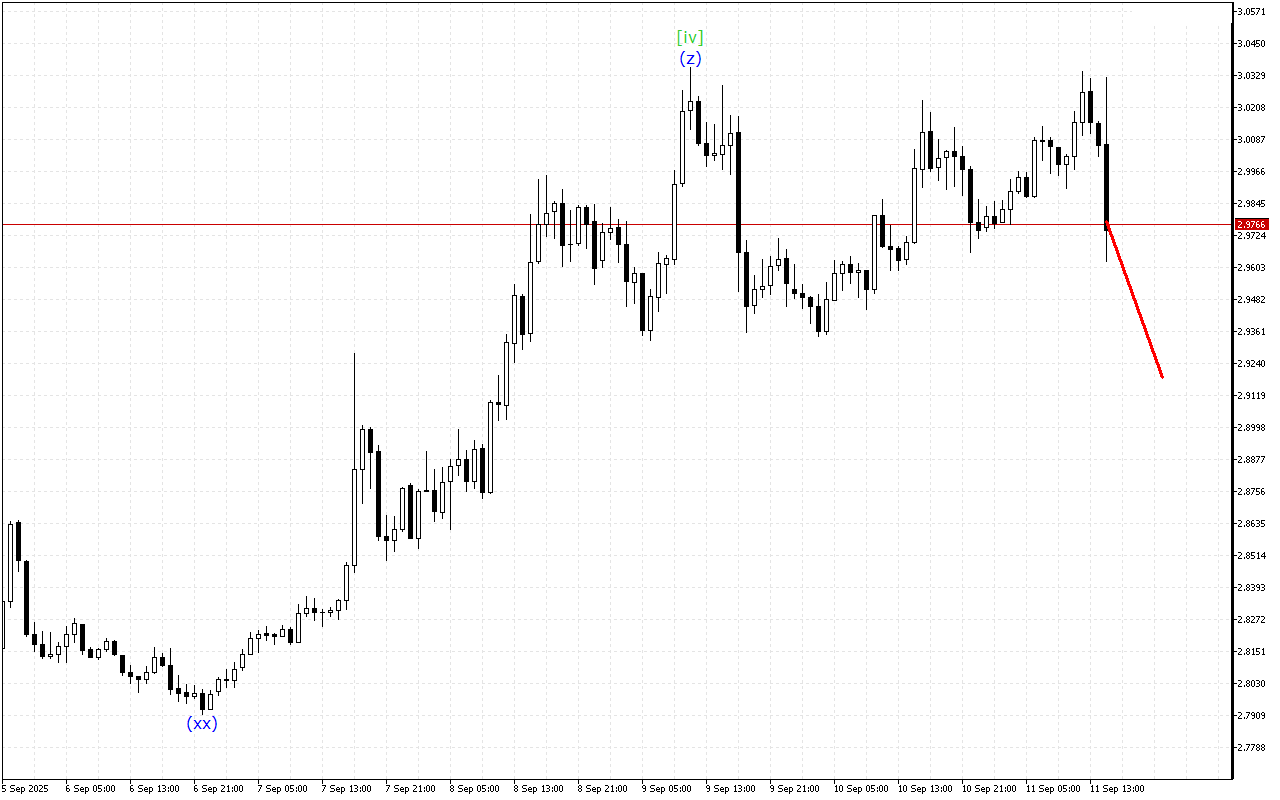
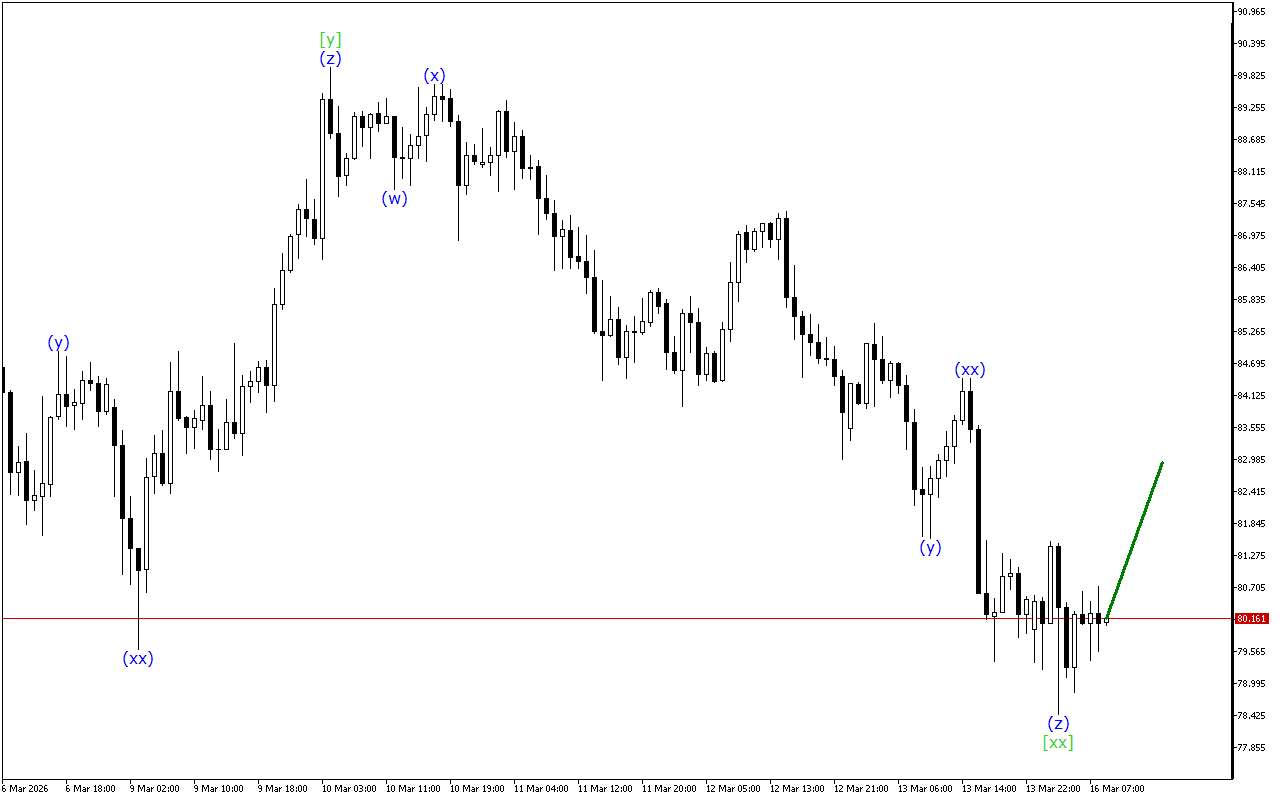
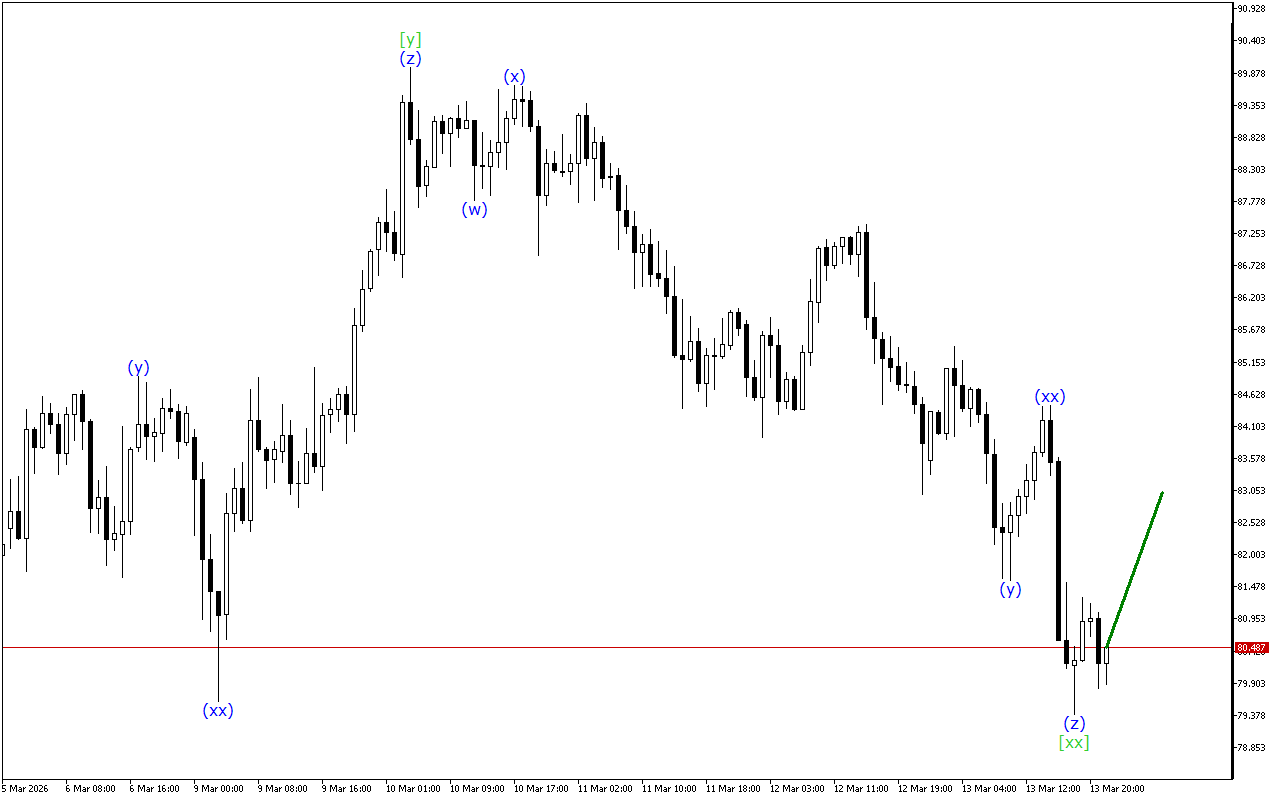
The XAGUSD chart shows signals for the end of the upward movement phase.The current dynamics of the movement indicate the formation of a triple three. At the moment, the wave…


The XAGUSD chart shows signals for the end of the upward movement phase.The current dynamics of the movement indicate the formation of a triple three. At the moment, the wave…
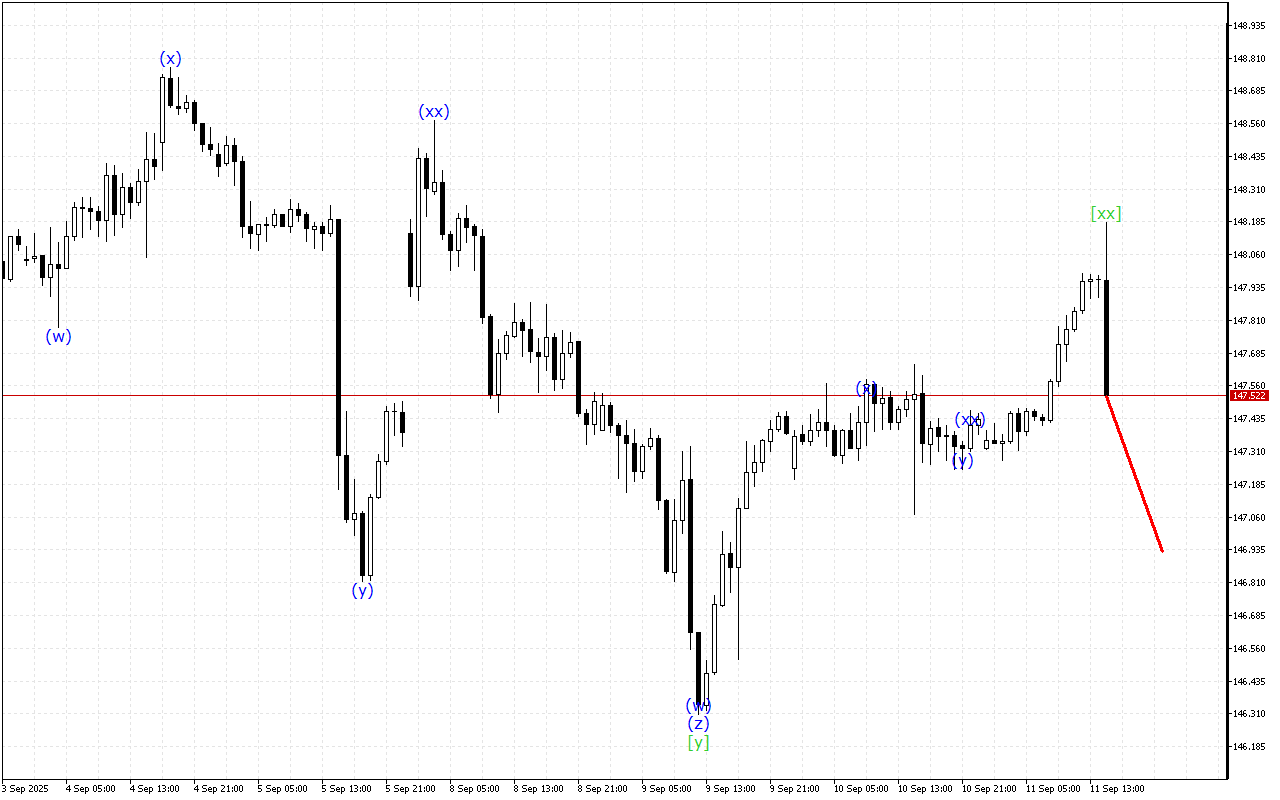
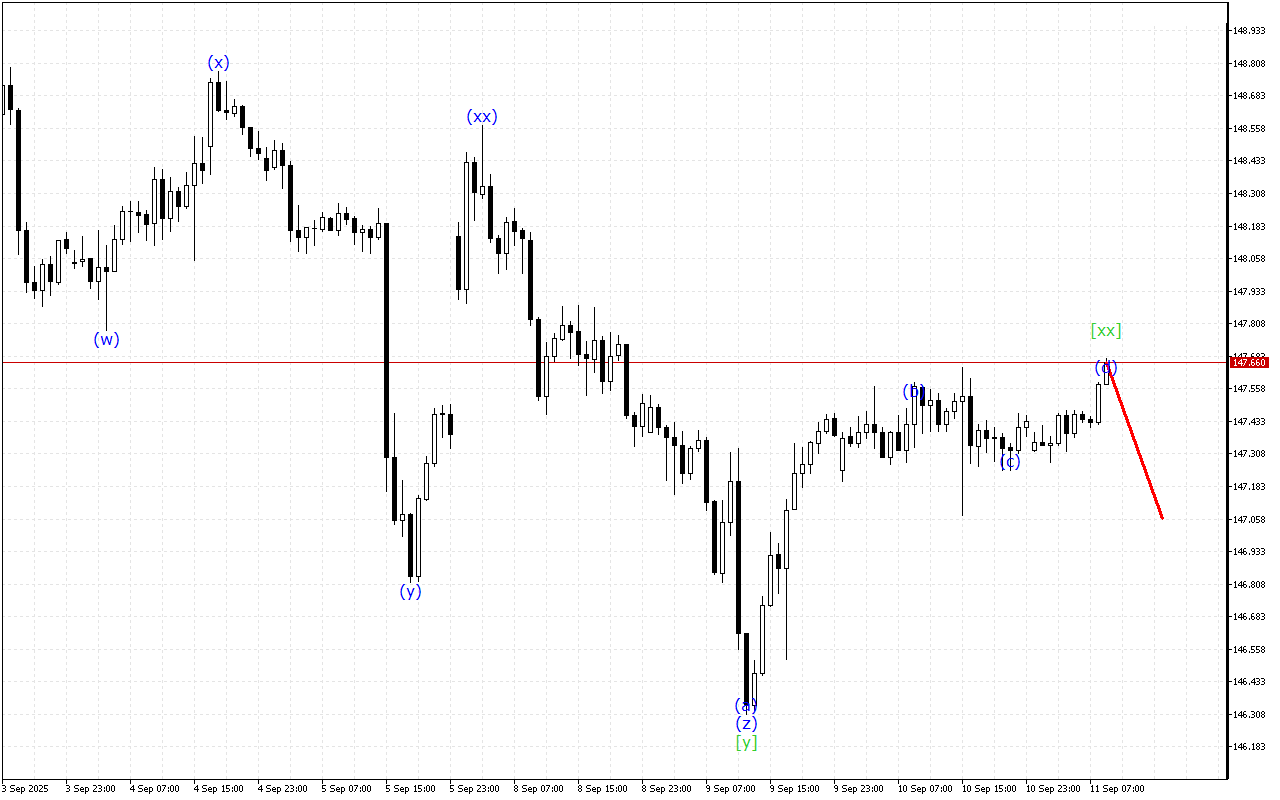
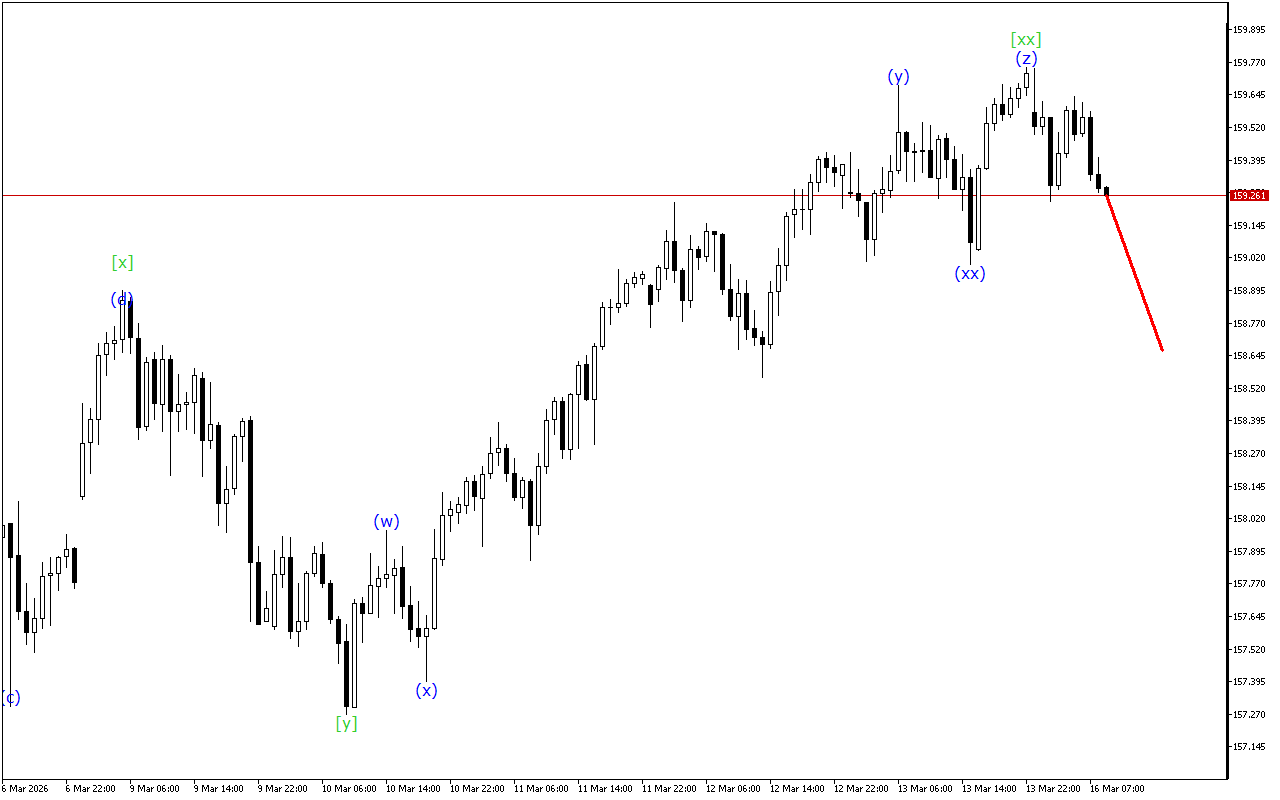
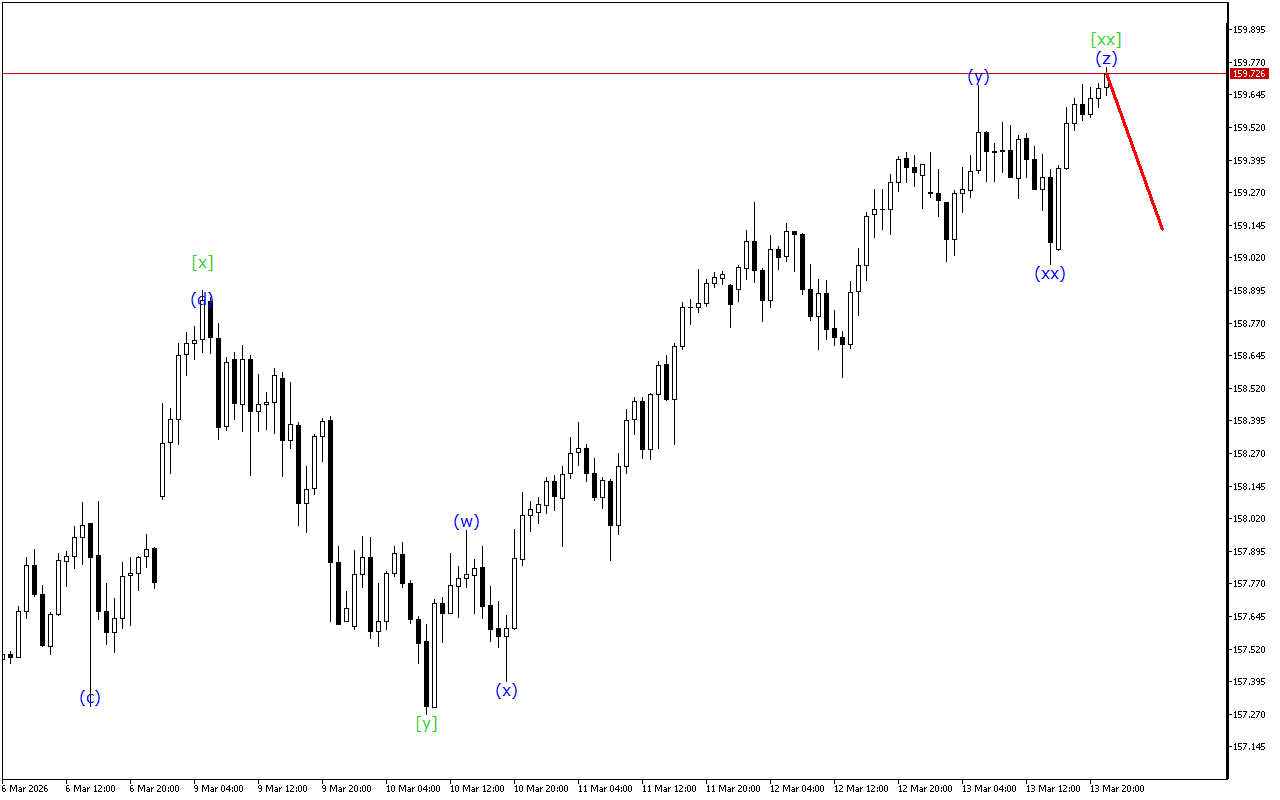
Although the market continues to move higher, the USDJPY chart is showing some signs of fatigue in the upward momentum.There is the development of a triple three wave structure on…
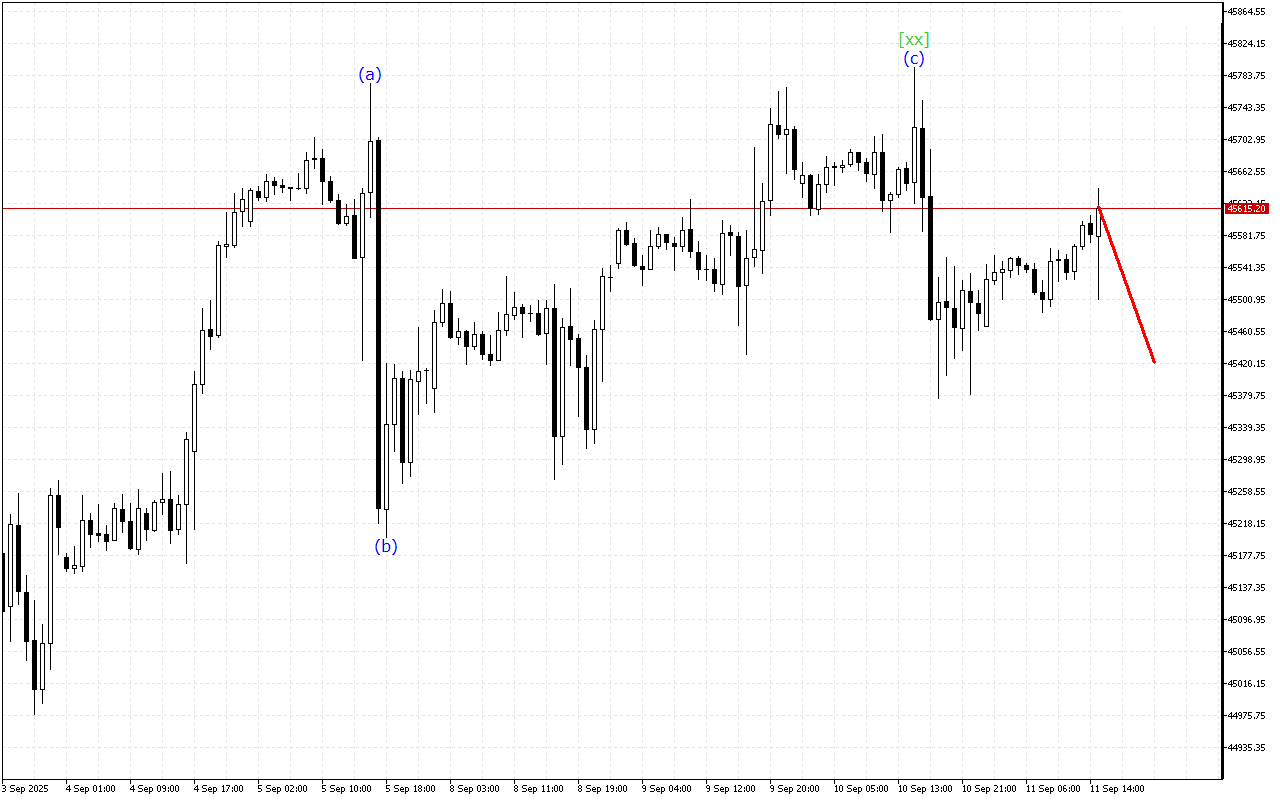
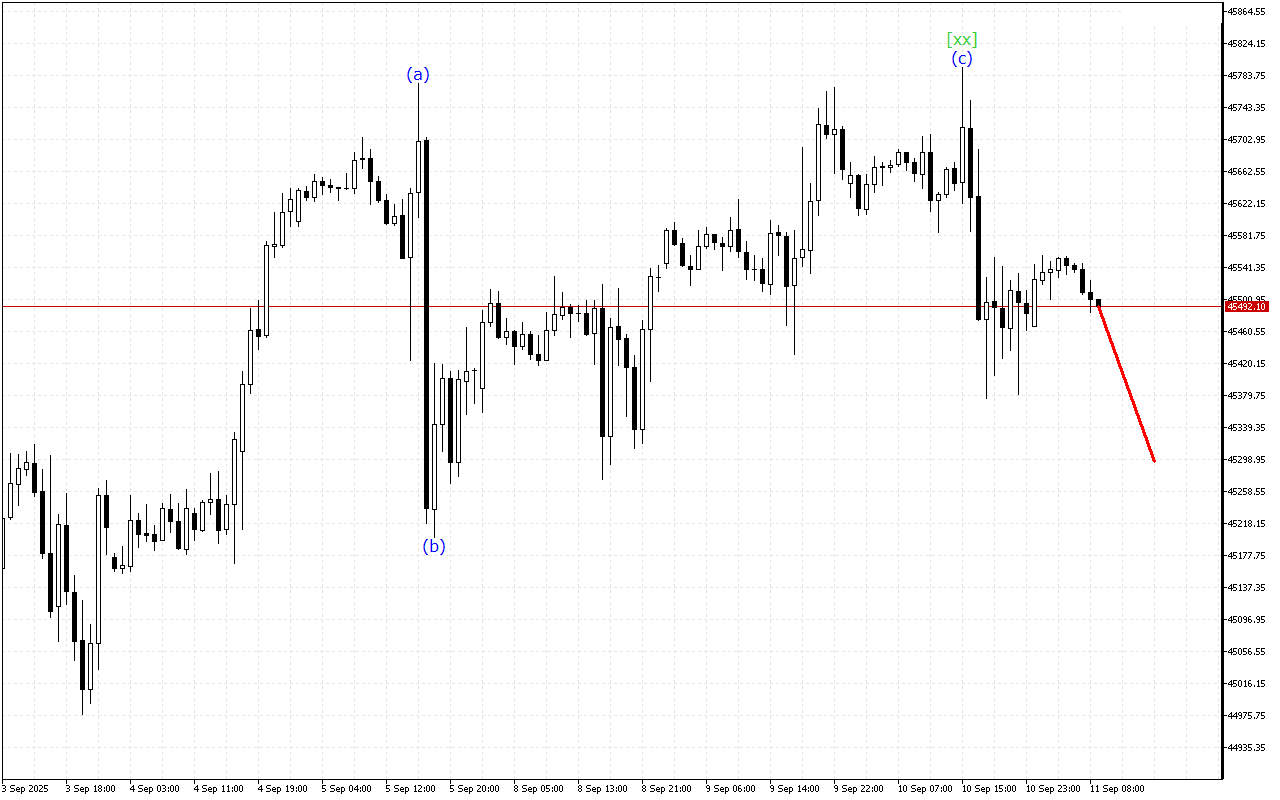
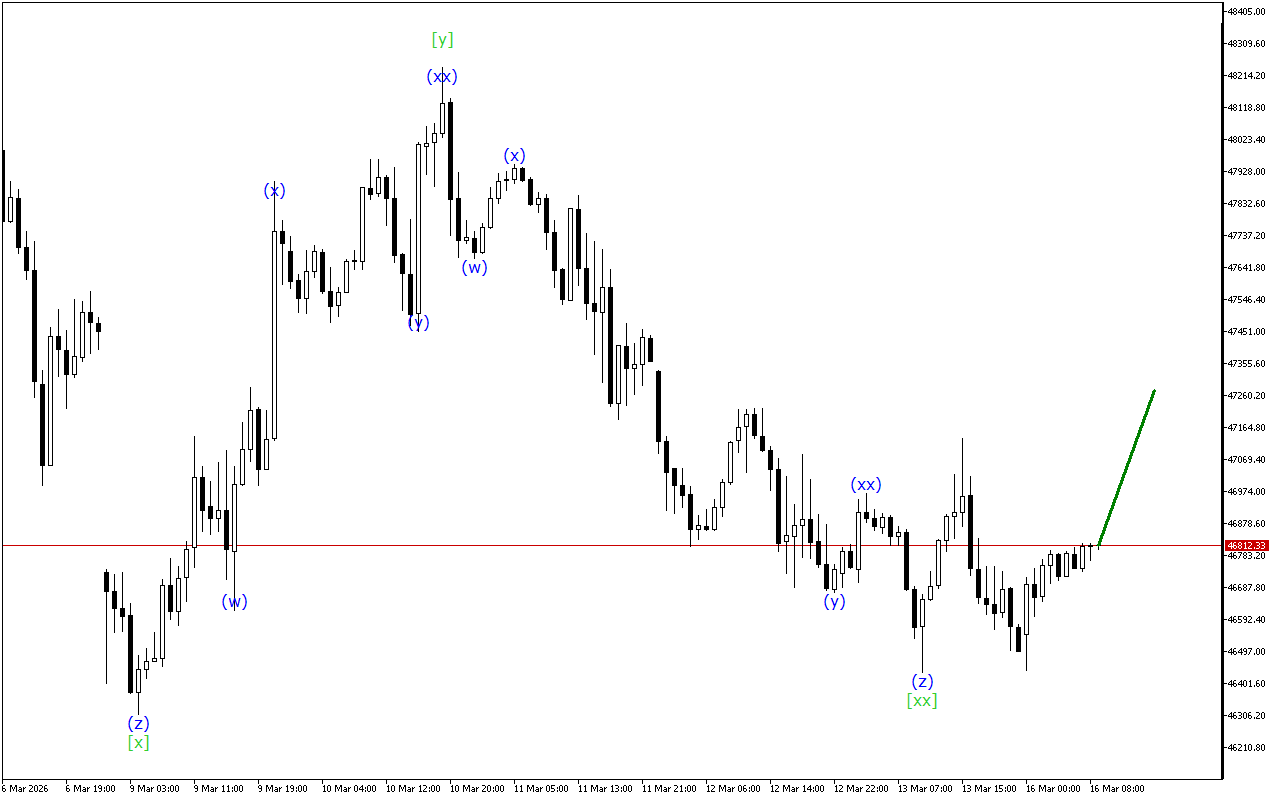
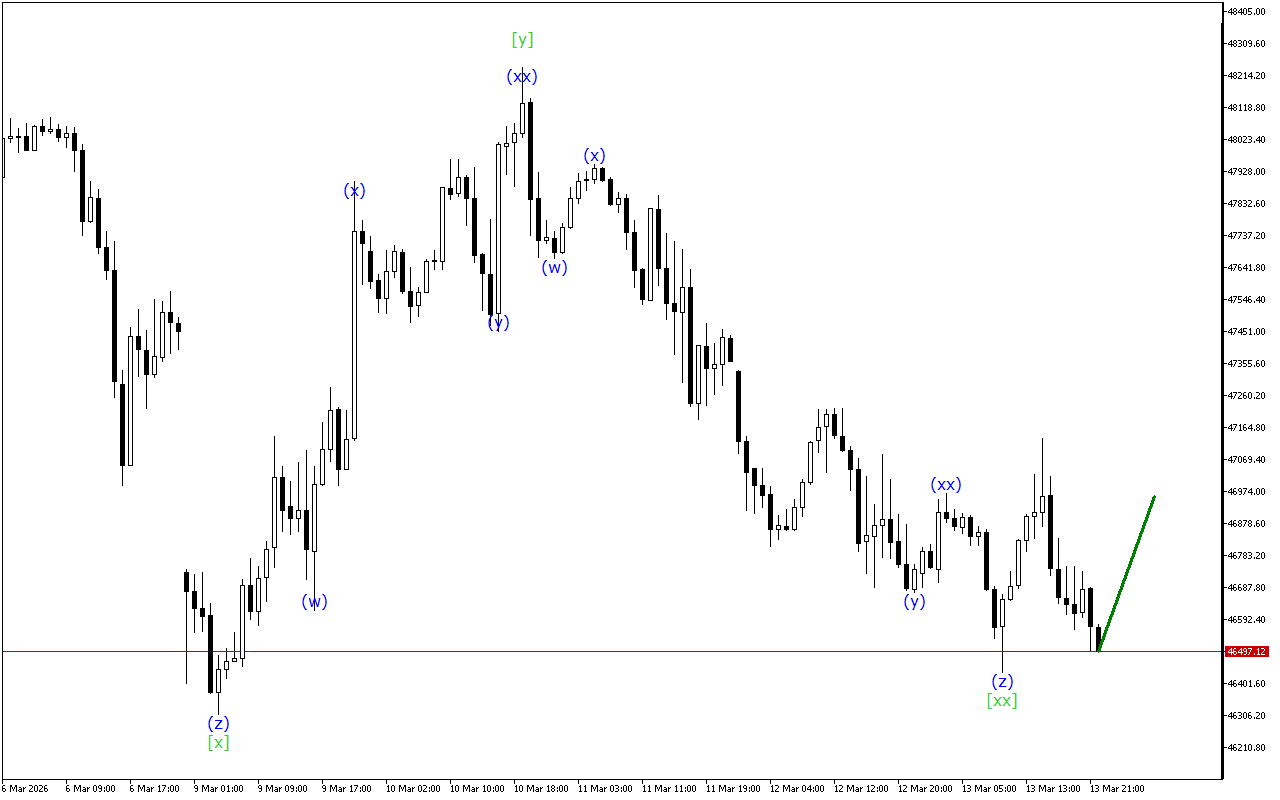
Amid general upward trend continuation, there are emerging signals pointing to a possible completion of the current uptrend in Dow Jones.There is the development of a triple three wave structure…
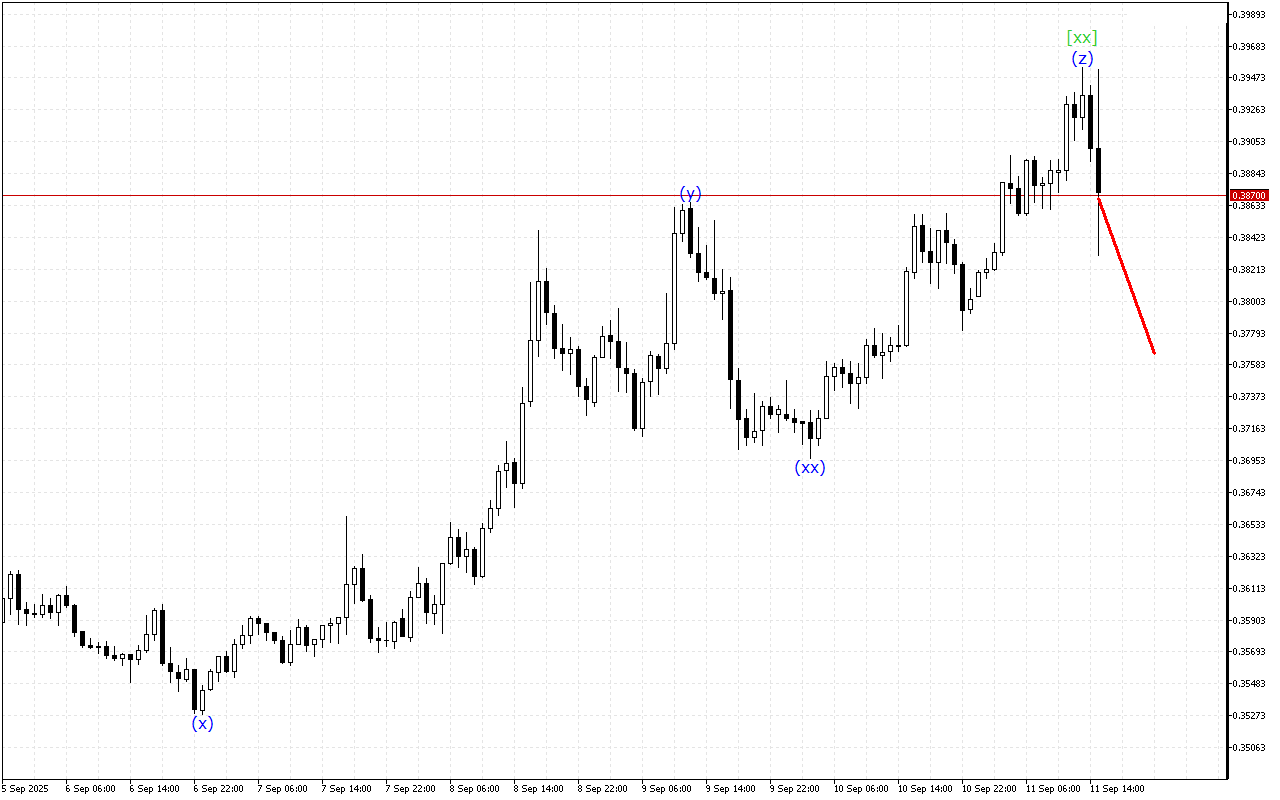
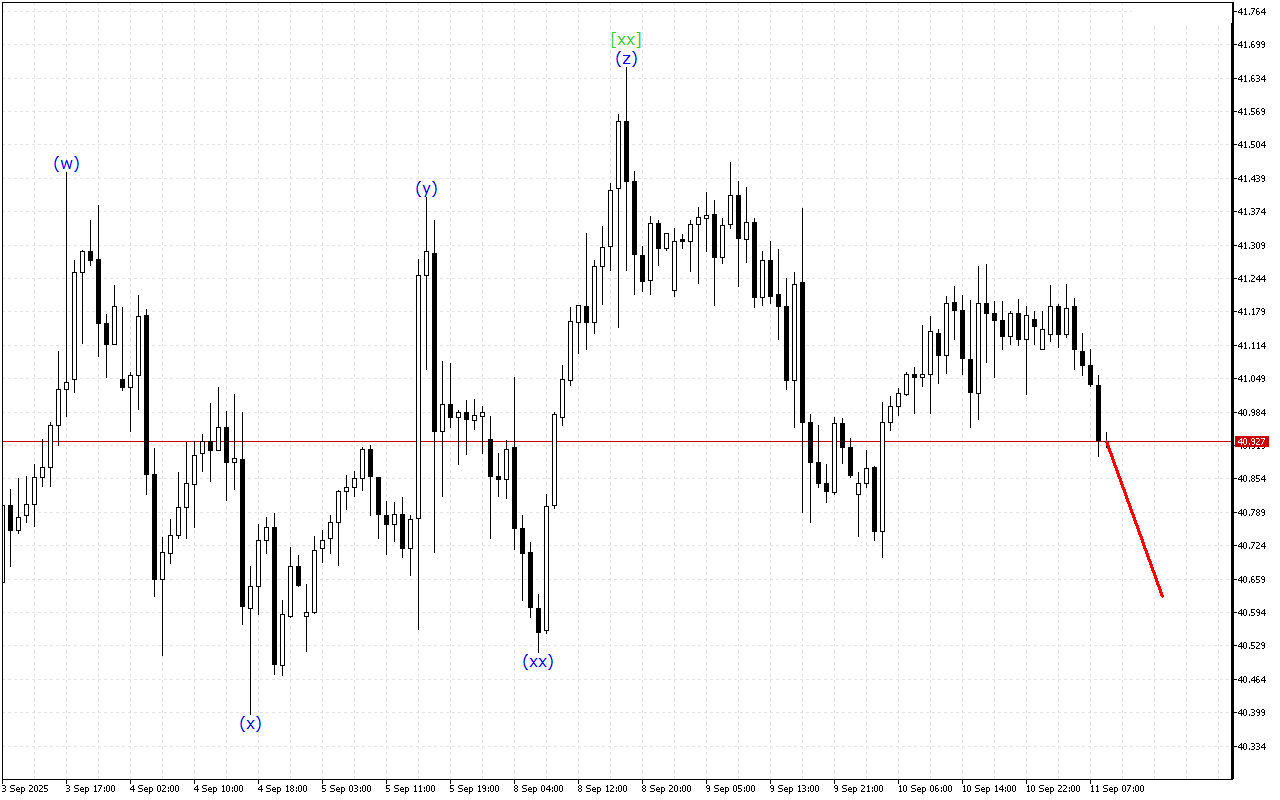
Although the market maintains an upward momentum prevalence, the Stellar chart shows signs of a possible end to this trend.The current dynamics of the movement indicate the formation of a…
The Ripple chart shows signals for the end of the upward movement phase.The analysis of the higher degree wave structure shows a falling wedge. Within this five-wave formation, the formation…
The price continues to move upward, but on the XAGUSD chart you can see signs of an impending completion of the current upward momentum.There is the development of a triple…
Although the market maintains an upward momentum prevalence, the USDJPY chart shows signs of a possible end to this trend.There is the development of a triple three wave structure on…
The price continues to move upward, but on the Dow Jones chart you can see signs of an impending completion of the current upward momentum.There is the development of a…
The price continues to move upward, but on the Ripple chart you can see signs of an impending completion of the current upward momentum.Within the higher time interval, the formation…
Amid general upward trend continuation, there are emerging signals pointing to a possible completion of the current uptrend in Stellar.The current dynamics of the movement indicate the formation of a…

