Dow Jones H1: Wave Analysis for the European Session on 12.9.2025
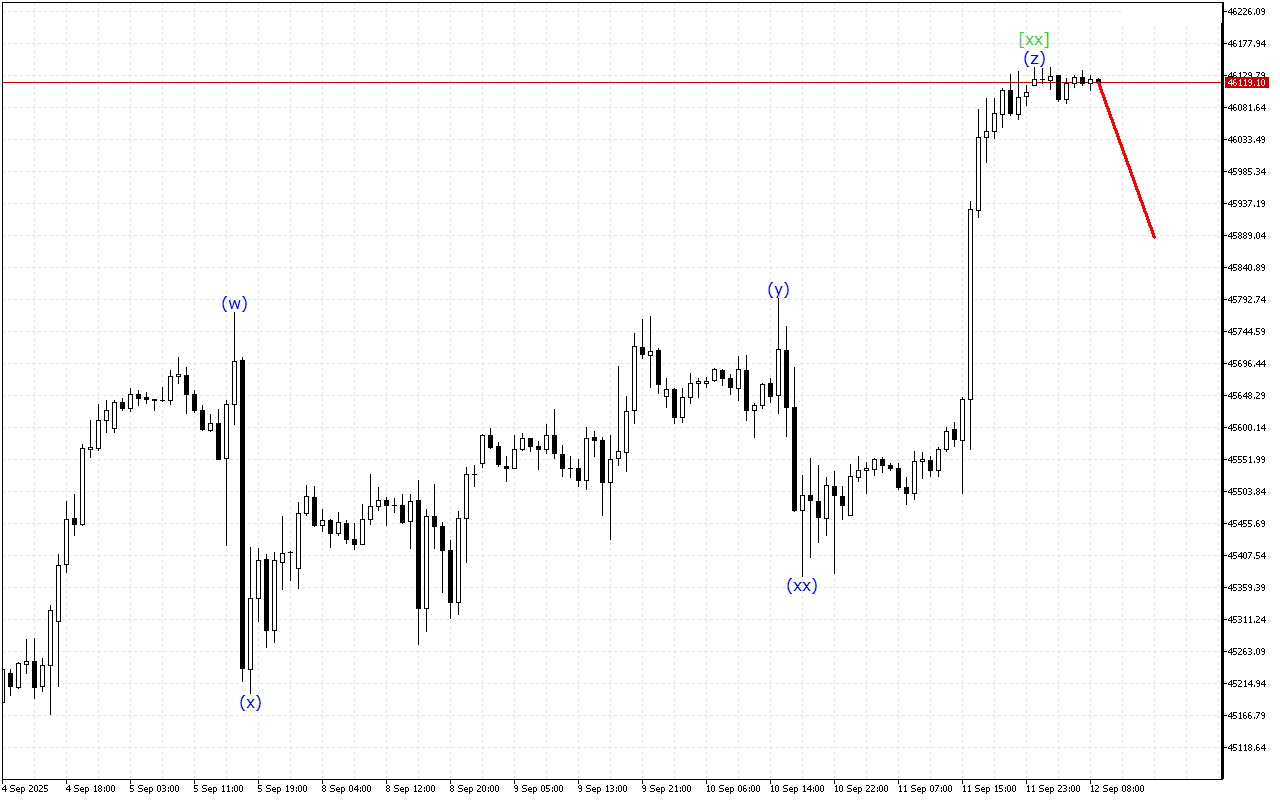
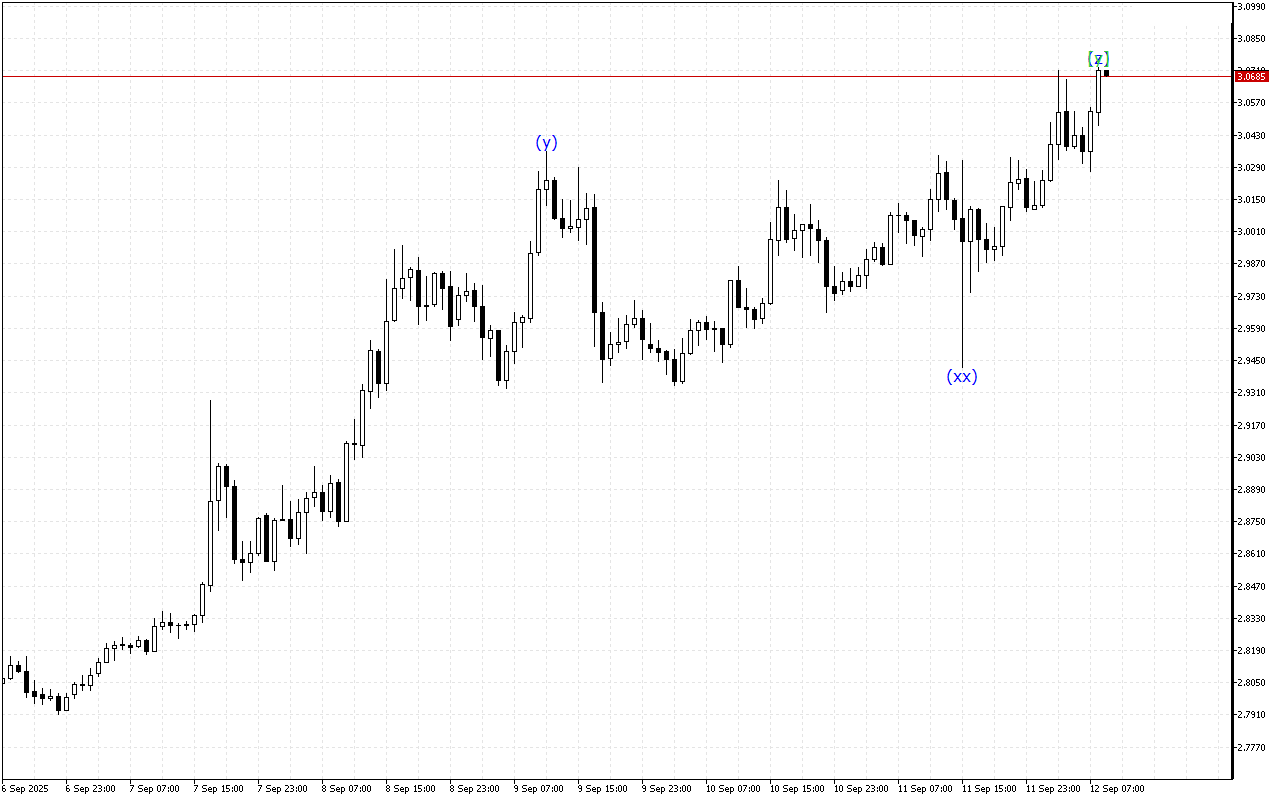
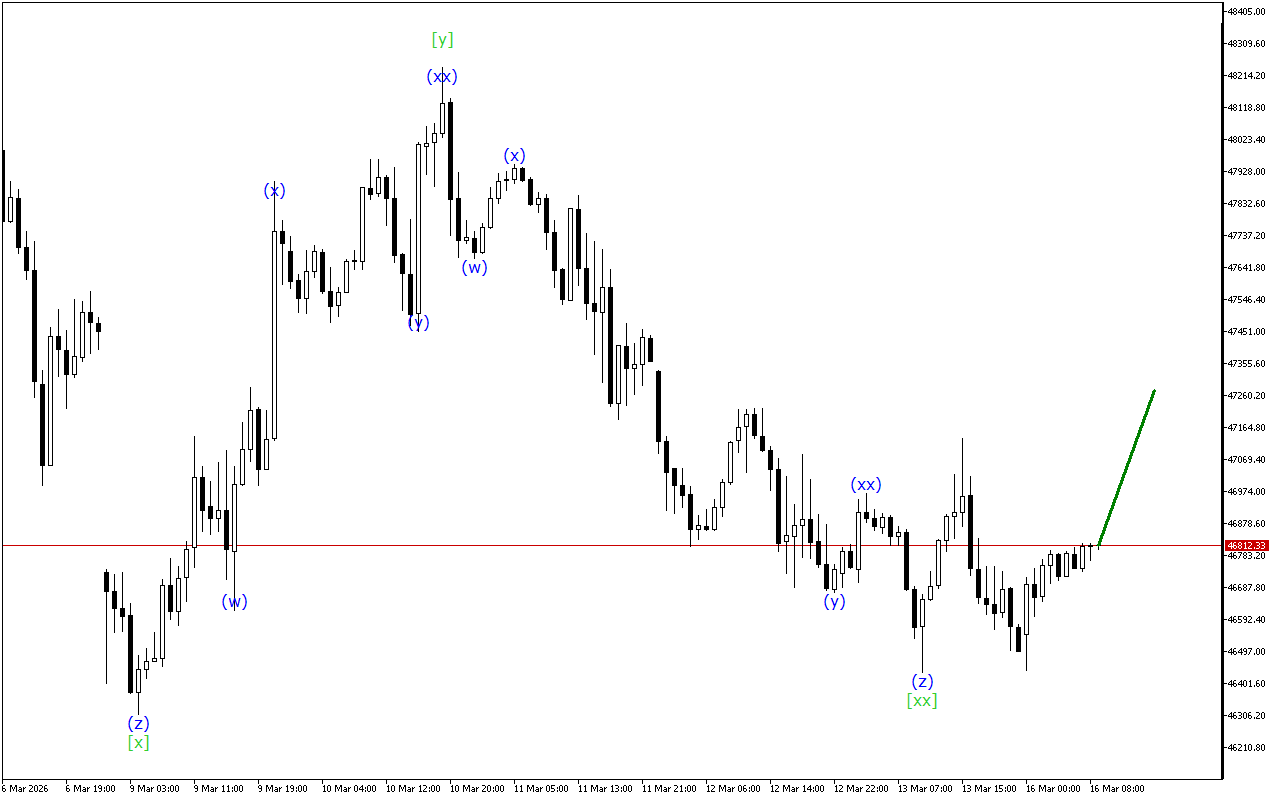
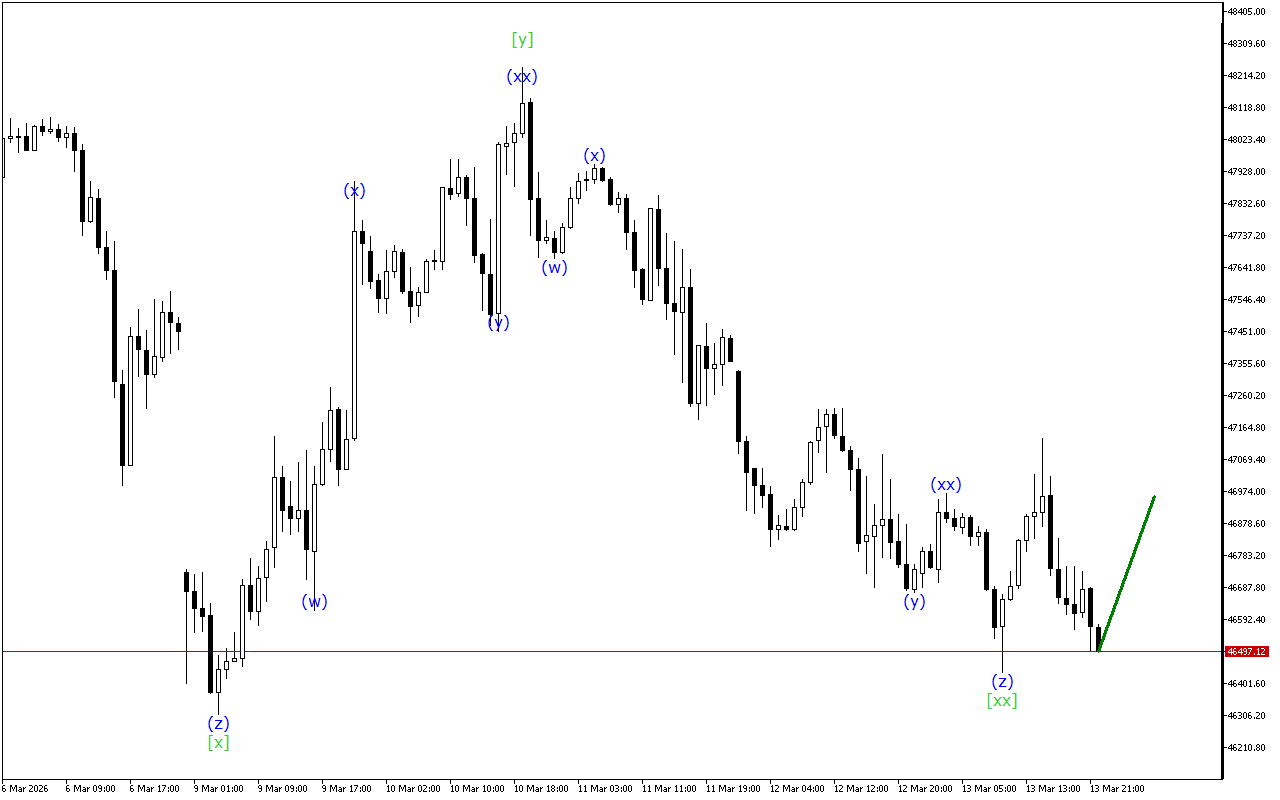
The price continues to move upward, but on the Dow Jones chart you can see signs of an impending completion of the current upward momentum.The current dynamics of the movement…


The price continues to move upward, but on the Dow Jones chart you can see signs of an impending completion of the current upward momentum.The current dynamics of the movement…
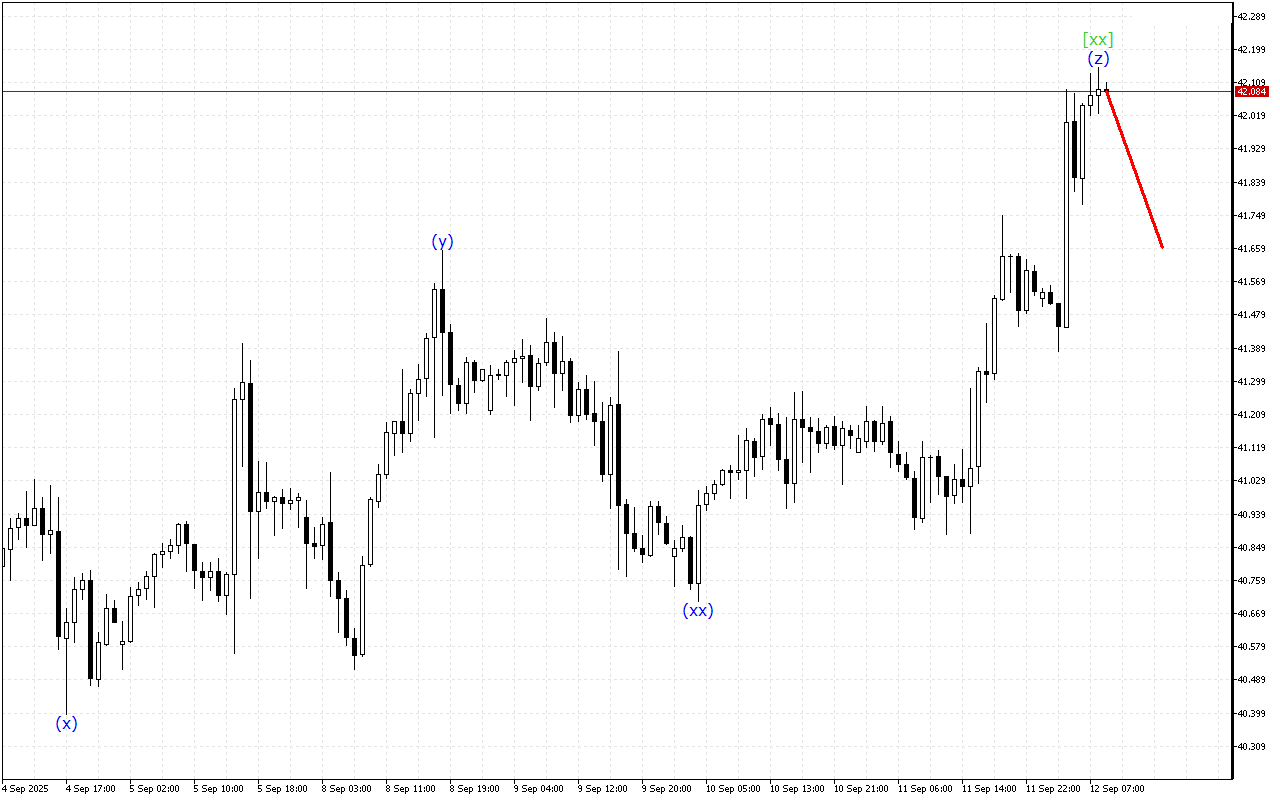
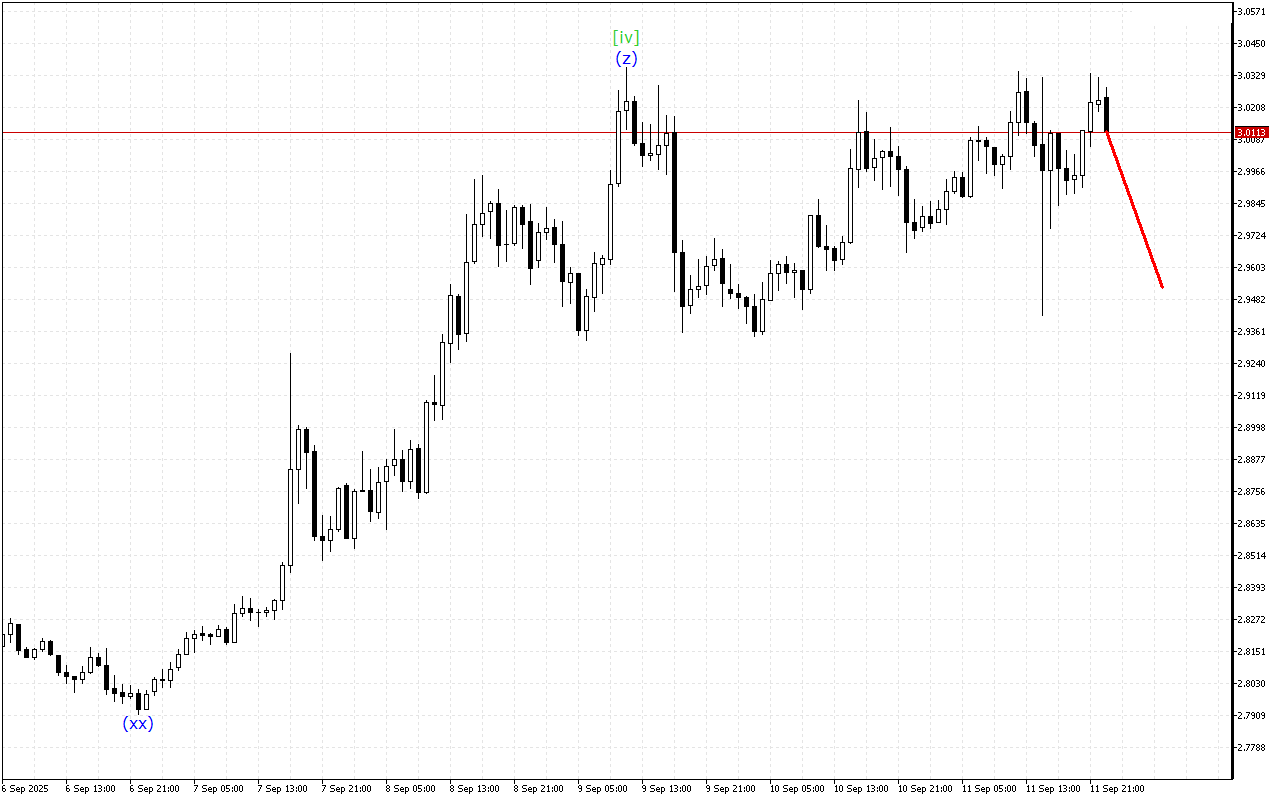
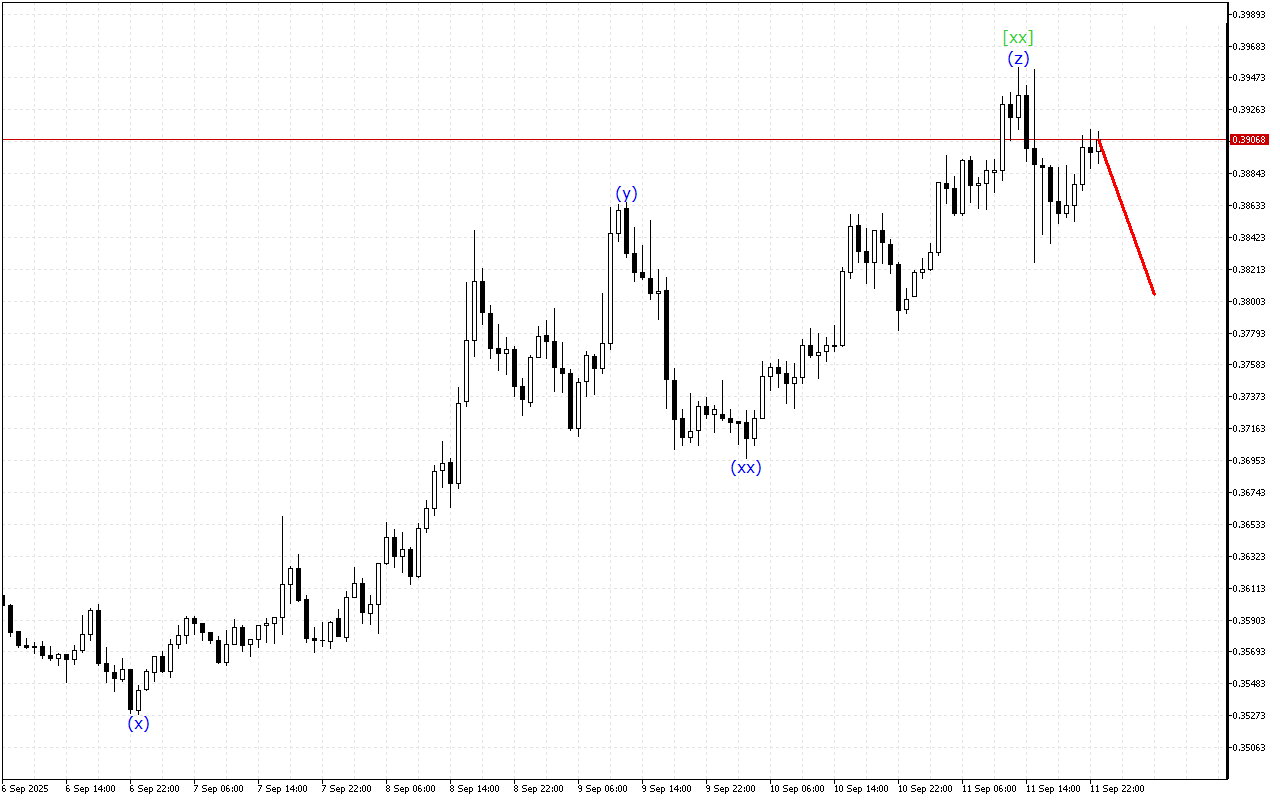
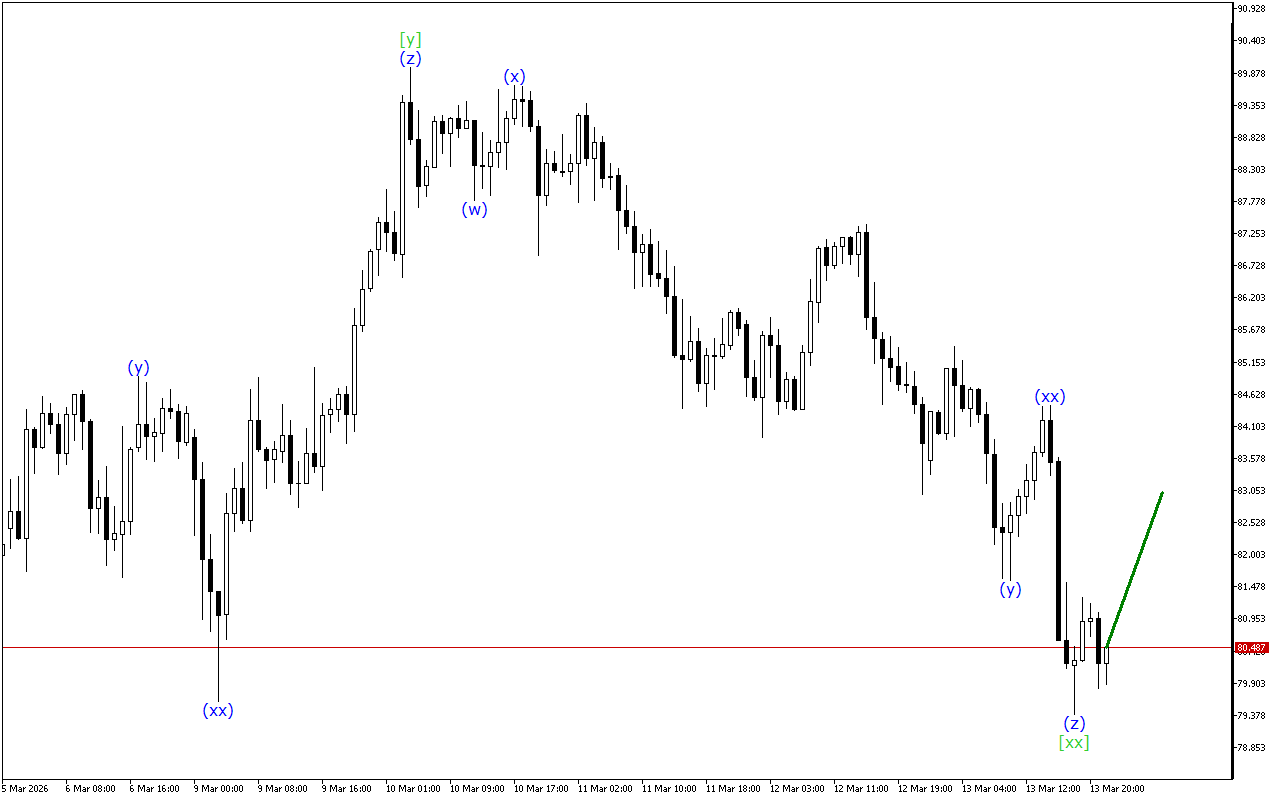
The price continues to move upward, but on the XAGUSD chart you can see signs of an impending completion of the current upward momentum.There is the development of a triple…
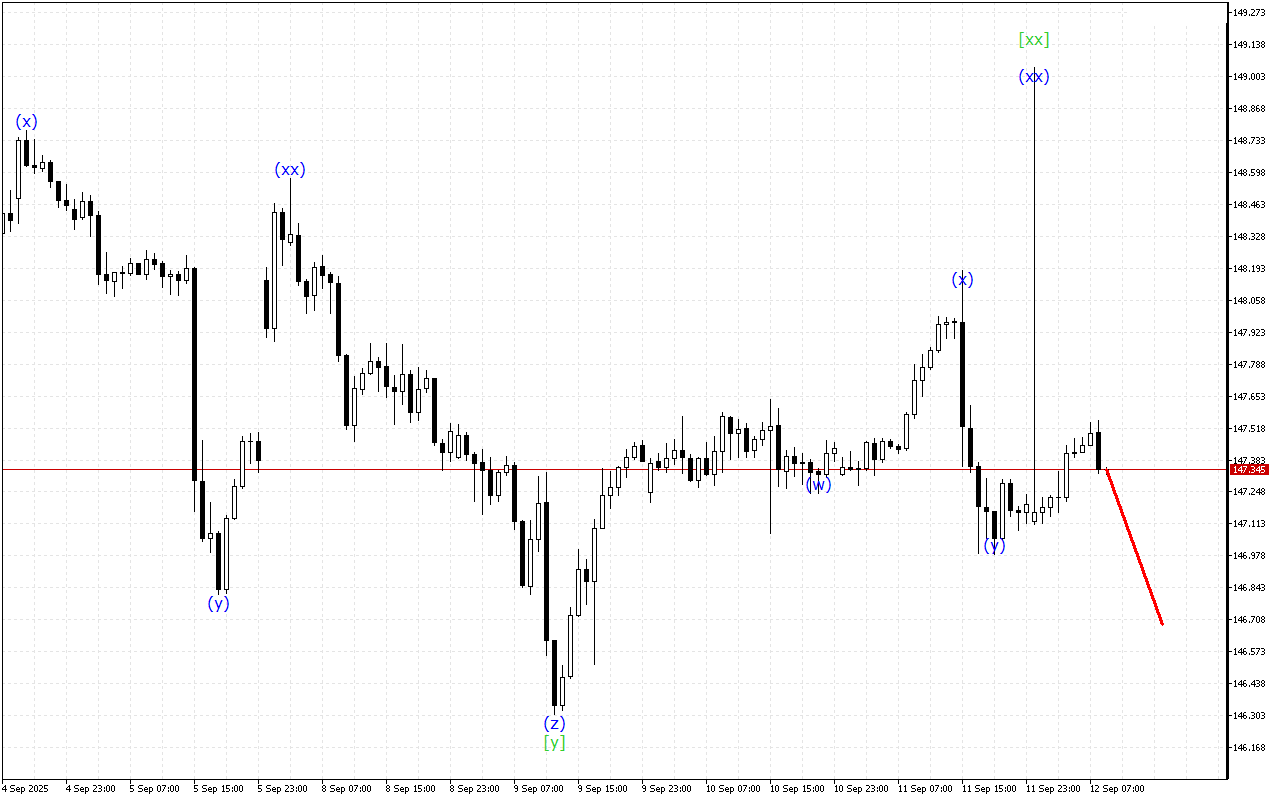
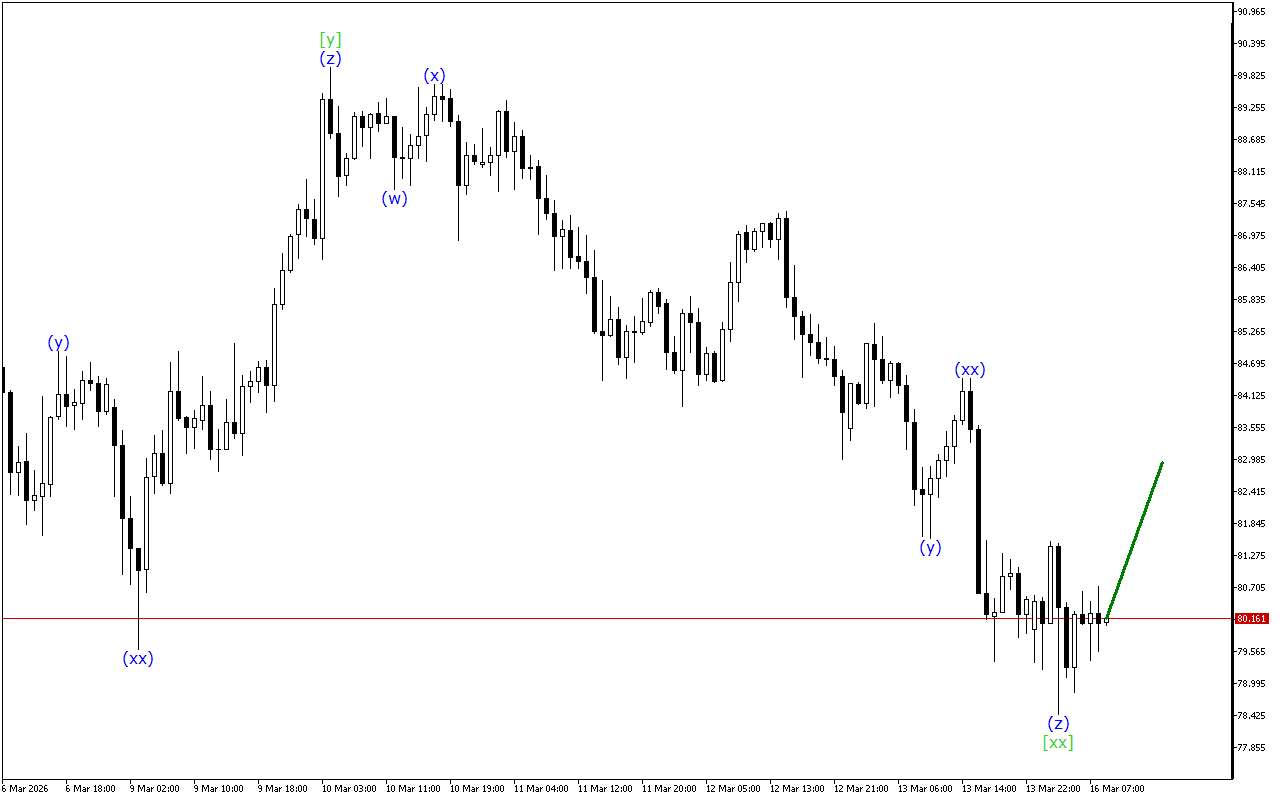
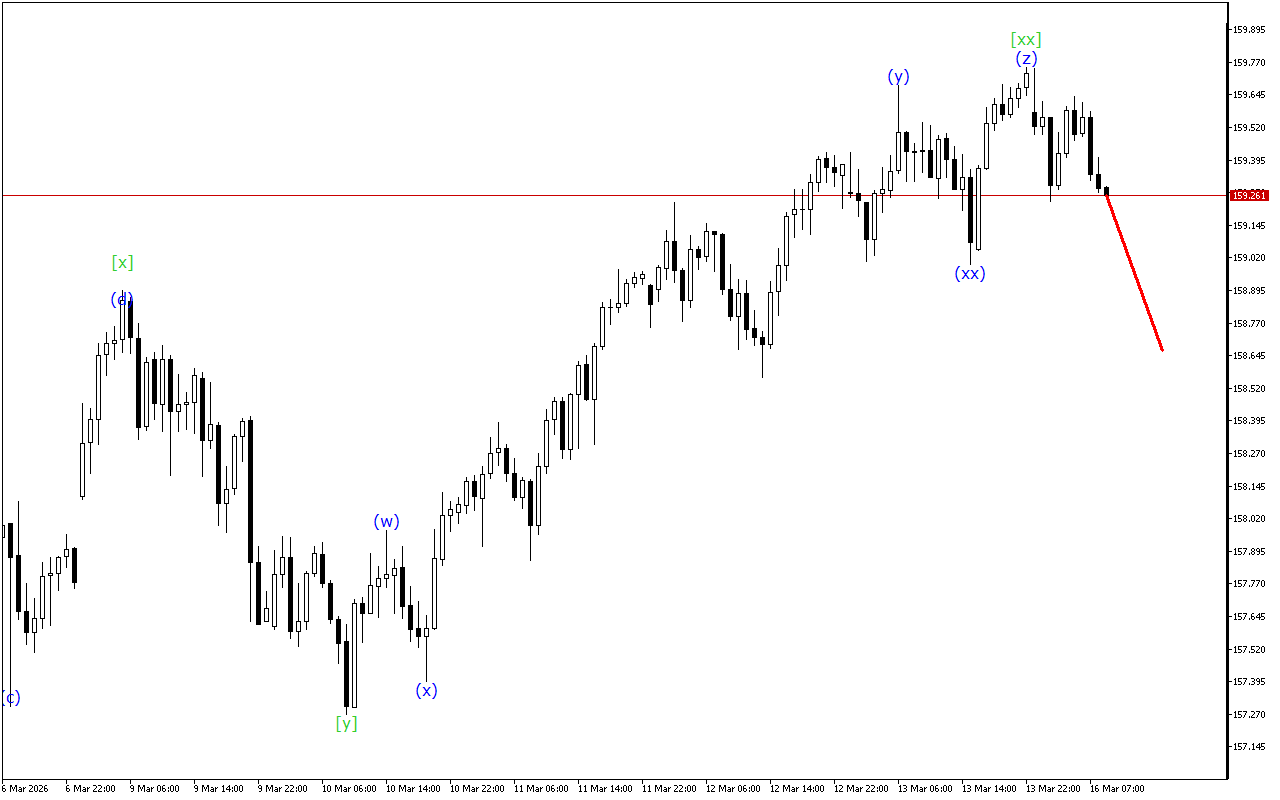
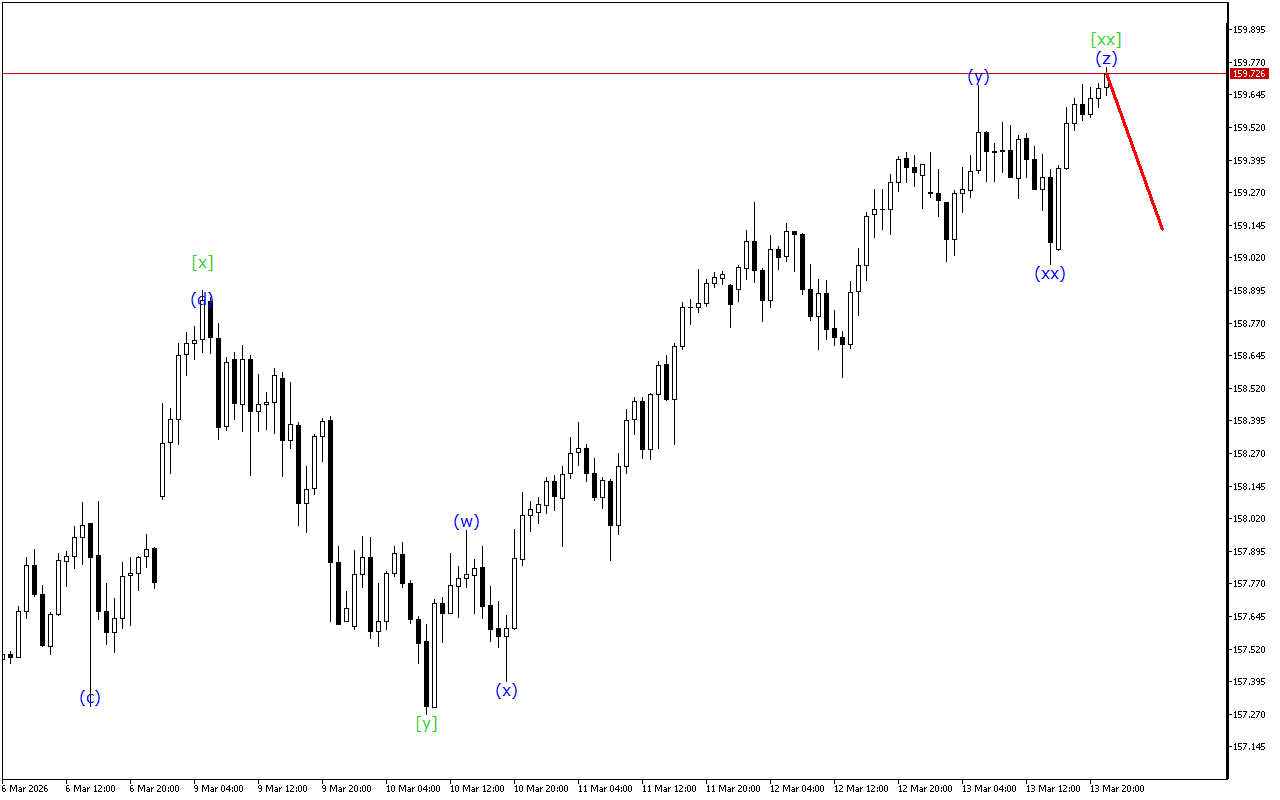
The USDJPY chart shows signals for the end of the upward movement phase.The current dynamics of the movement indicate the formation of a triple three. At the moment, the wave…
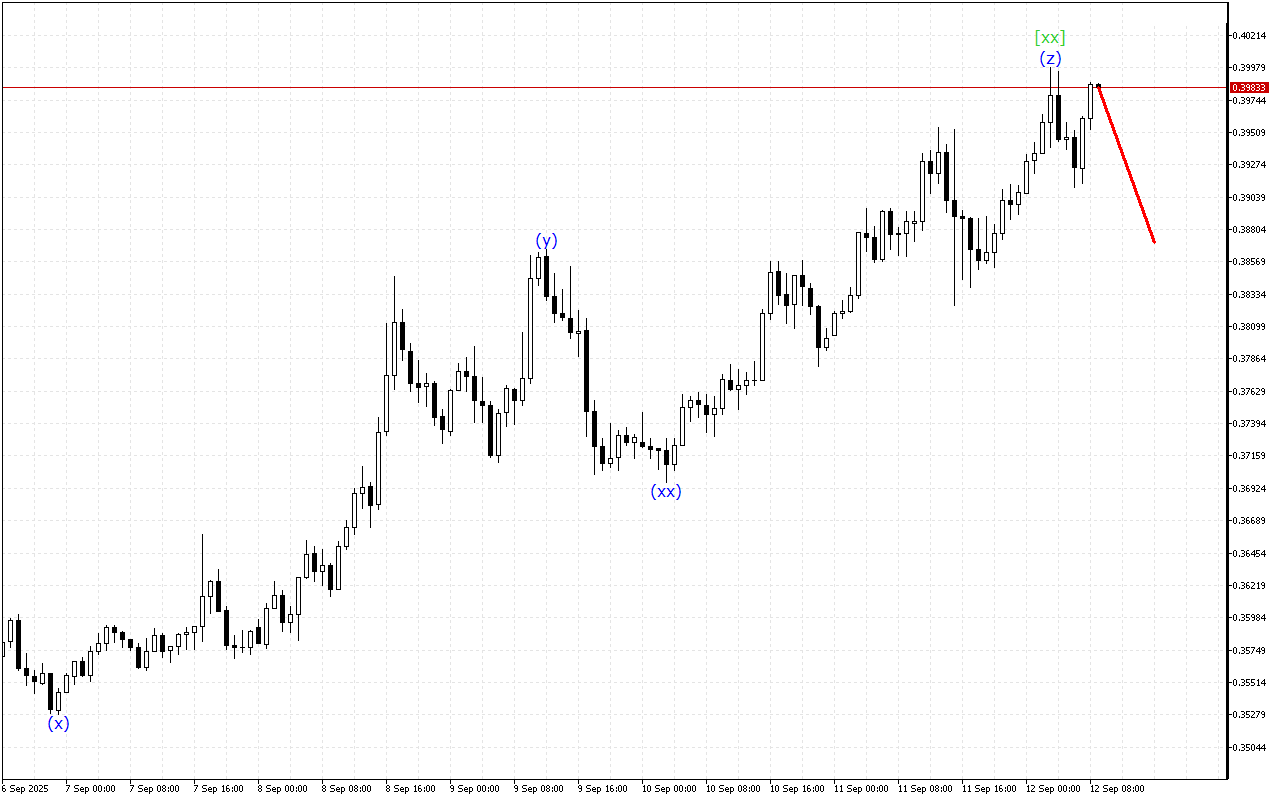
The Stellar chart shows signals for the end of the upward movement phase.The current dynamics of the movement indicate the formation of a triple three. At the moment, the wave…
The Ripple chart shows mixed trading dynamics, with periods of both positive and negative price activity.The wave structure of a higher-degree is a correctional area. Now the formation of the…
The price continues to move upward, but on the XAGUSD chart you can see signs of an impending completion of the current upward momentum.The current dynamics of the movement indicate…
The USDJPY chart shows signals for the end of the upward movement phase.The current dynamics of the movement indicate the formation of a triple three. At the moment, the wave…
The price continues to move upward, but on the Dow Jones chart you can see signs of an impending completion of the current upward momentum.The current dynamics of the movement…
The price continues to move upward, but on the Ripple chart you can see signs of an impending completion of the current upward momentum.The analysis of the higher degree wave…
The price continues to move upward, but on the Stellar chart you can see signs of an impending completion of the current upward momentum.There is the development of a triple…


