

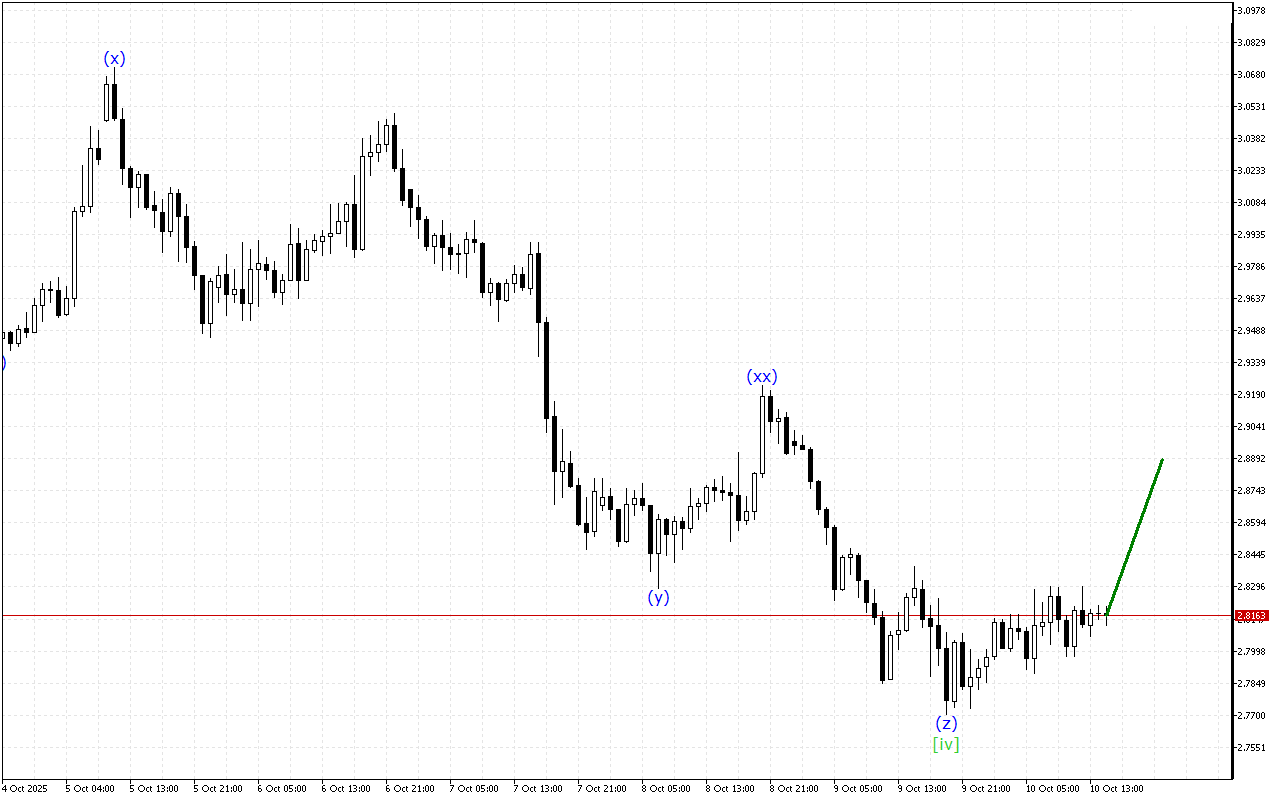
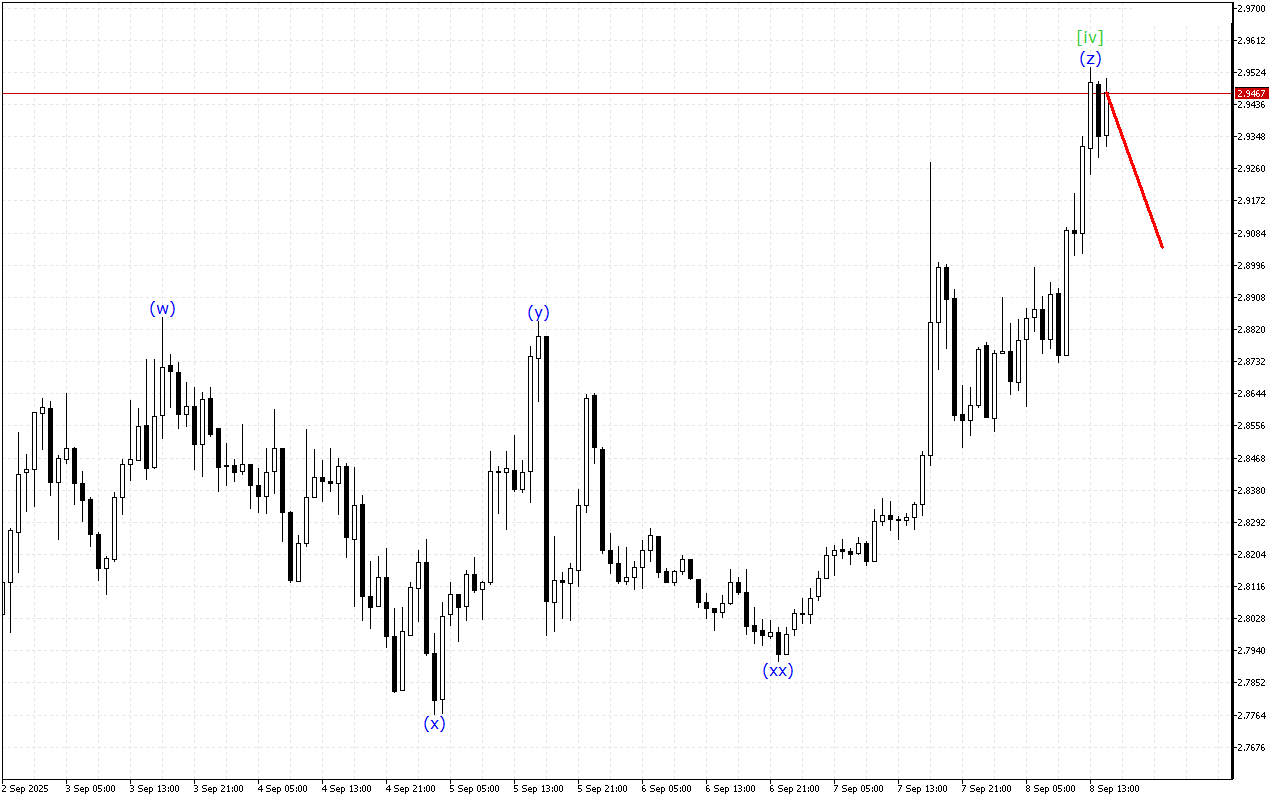
Ripple H1: Wave Analysis for the American Session on 10.10.2025
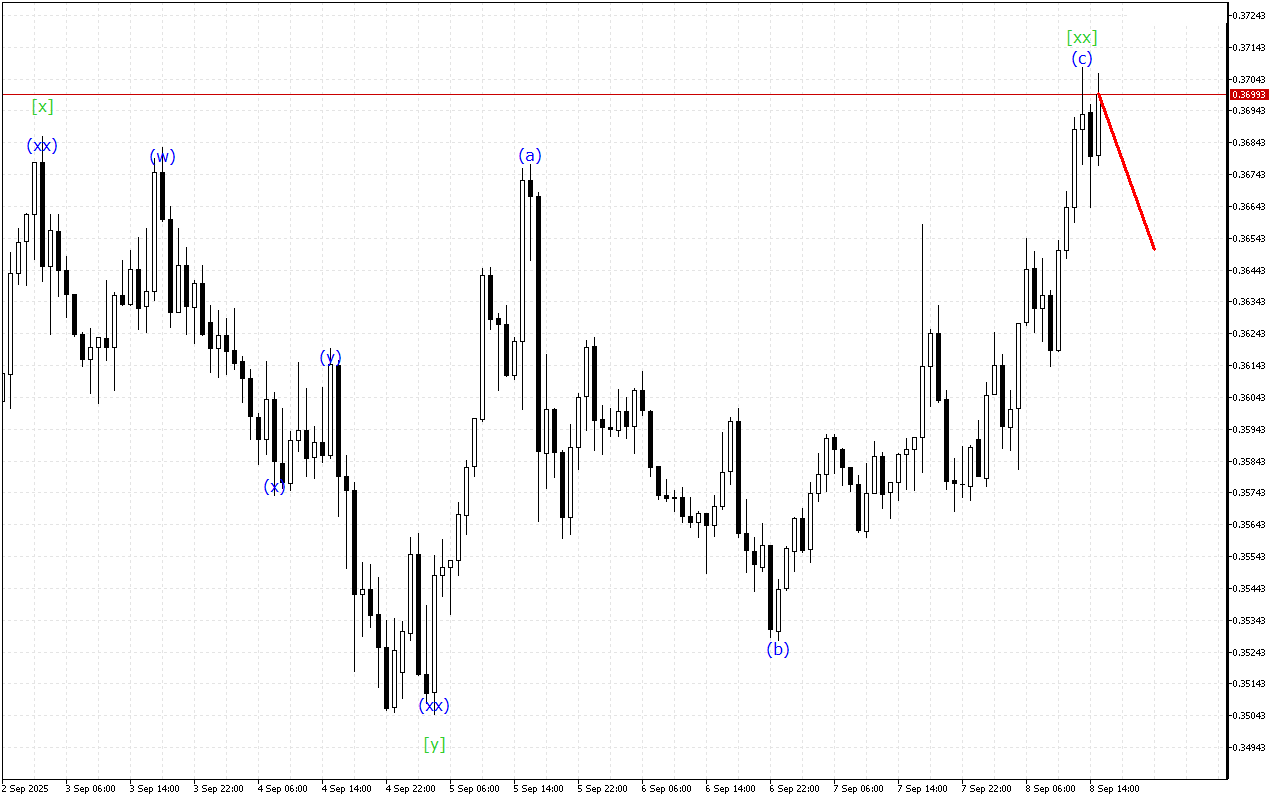
The market remains in a downtrend, though wave analysis indicates a potential end to the current trend.The higher-degree wave structure resembles a rising wedge. Within this five-wave structure, the formation…