Dow Jones H1: Wave Analysis for the Asian Session on 9.7.2025
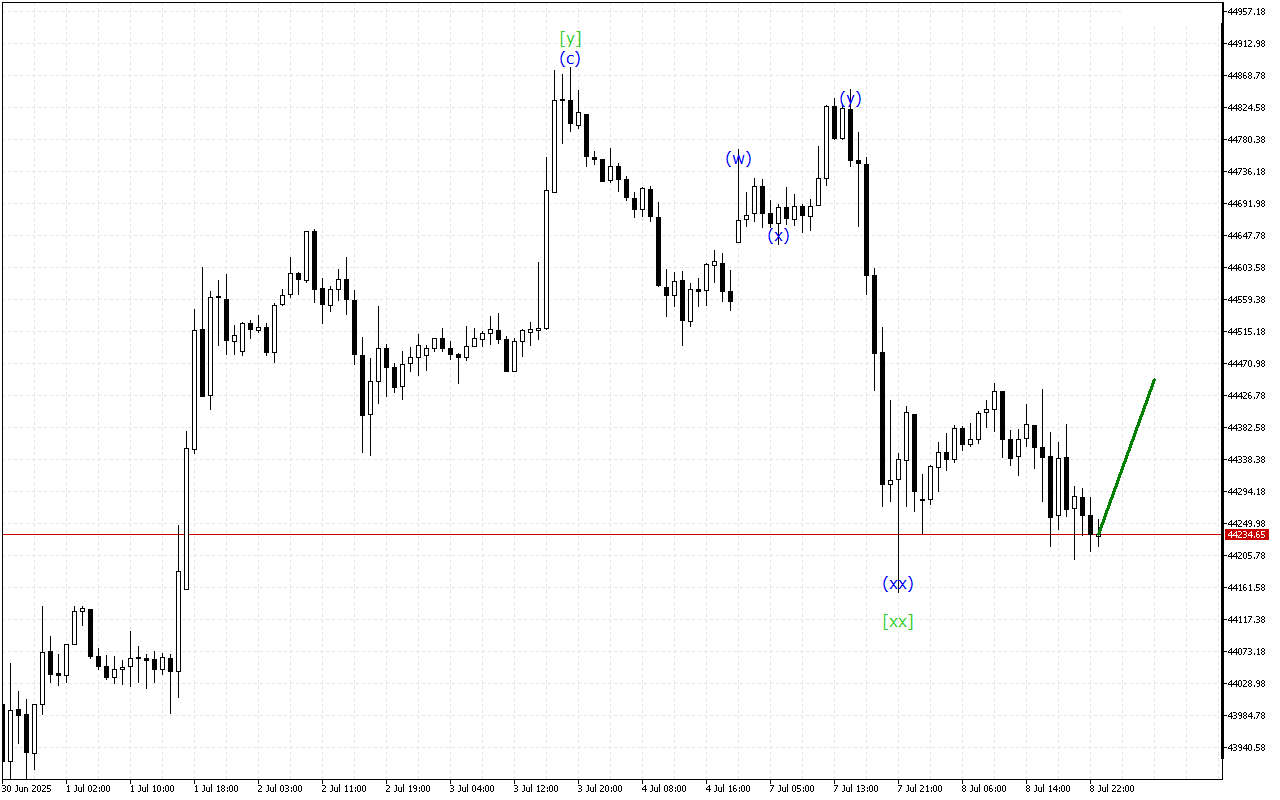
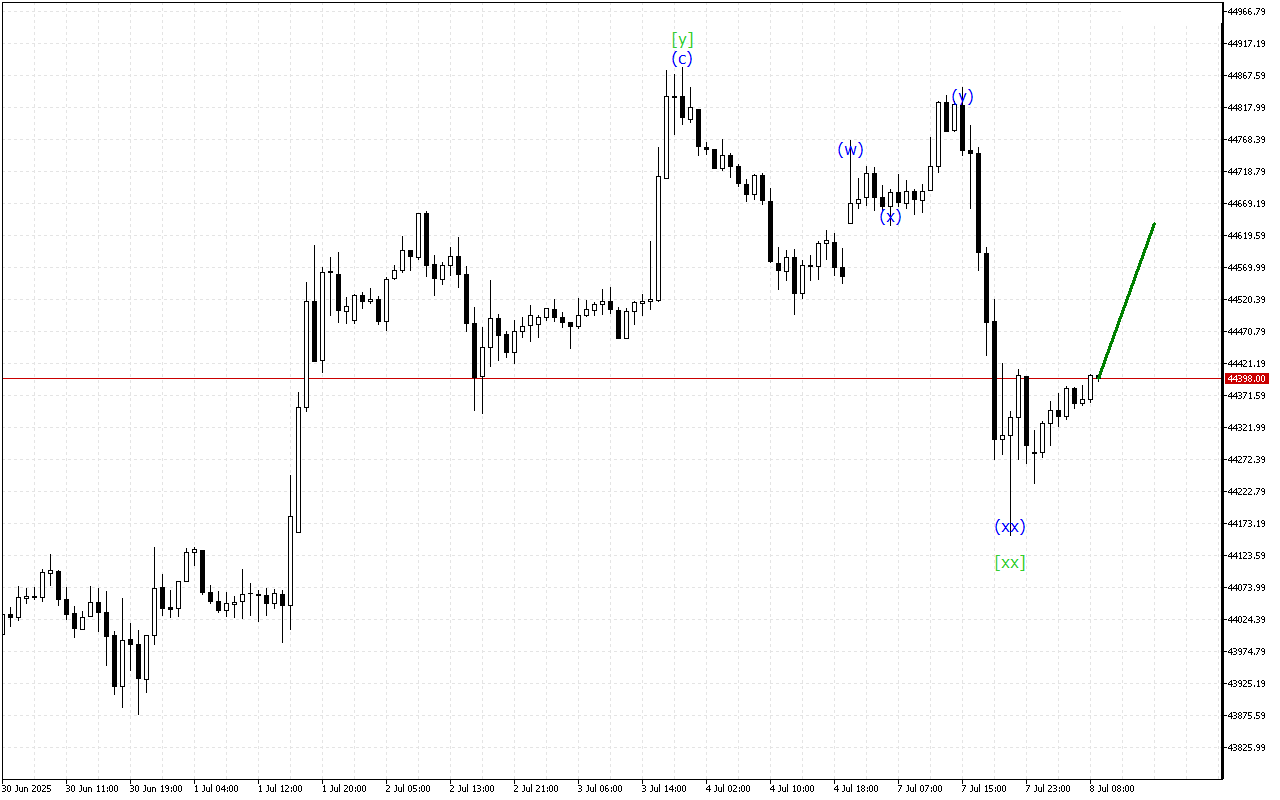
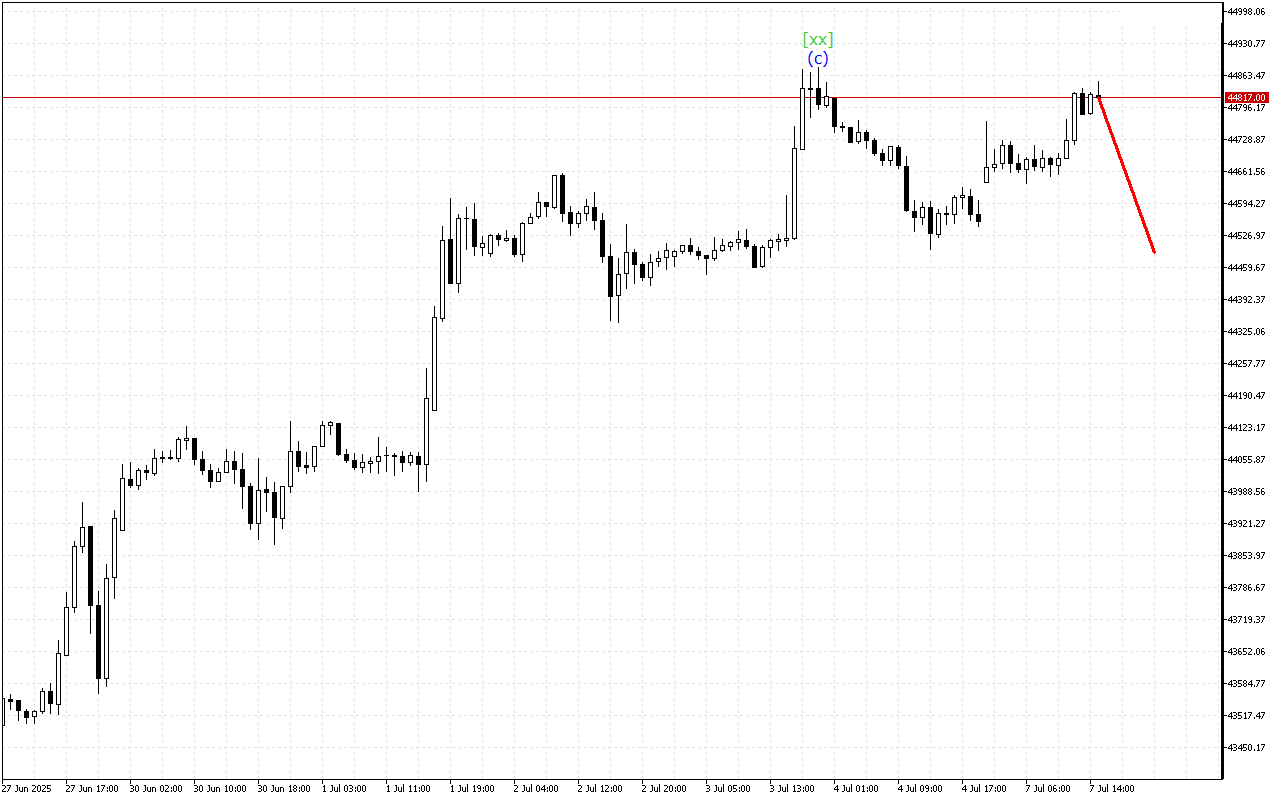
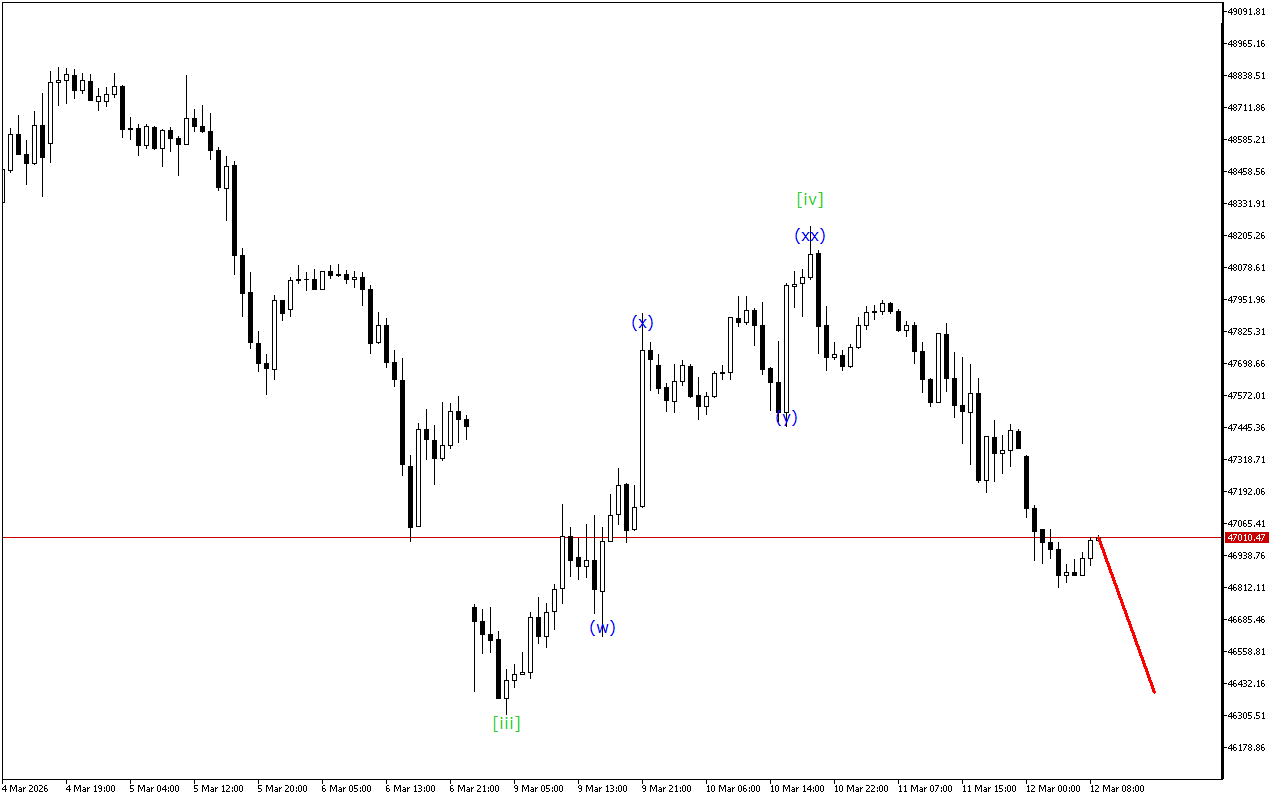
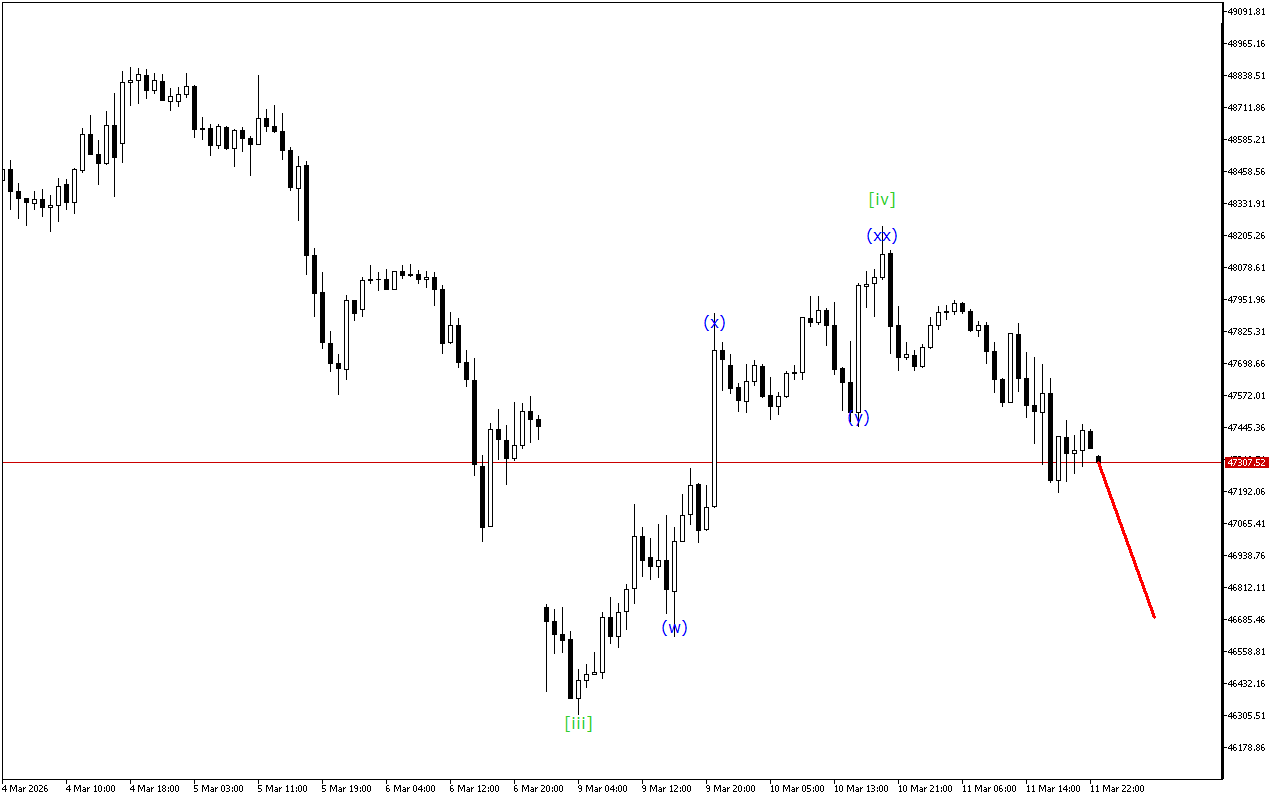
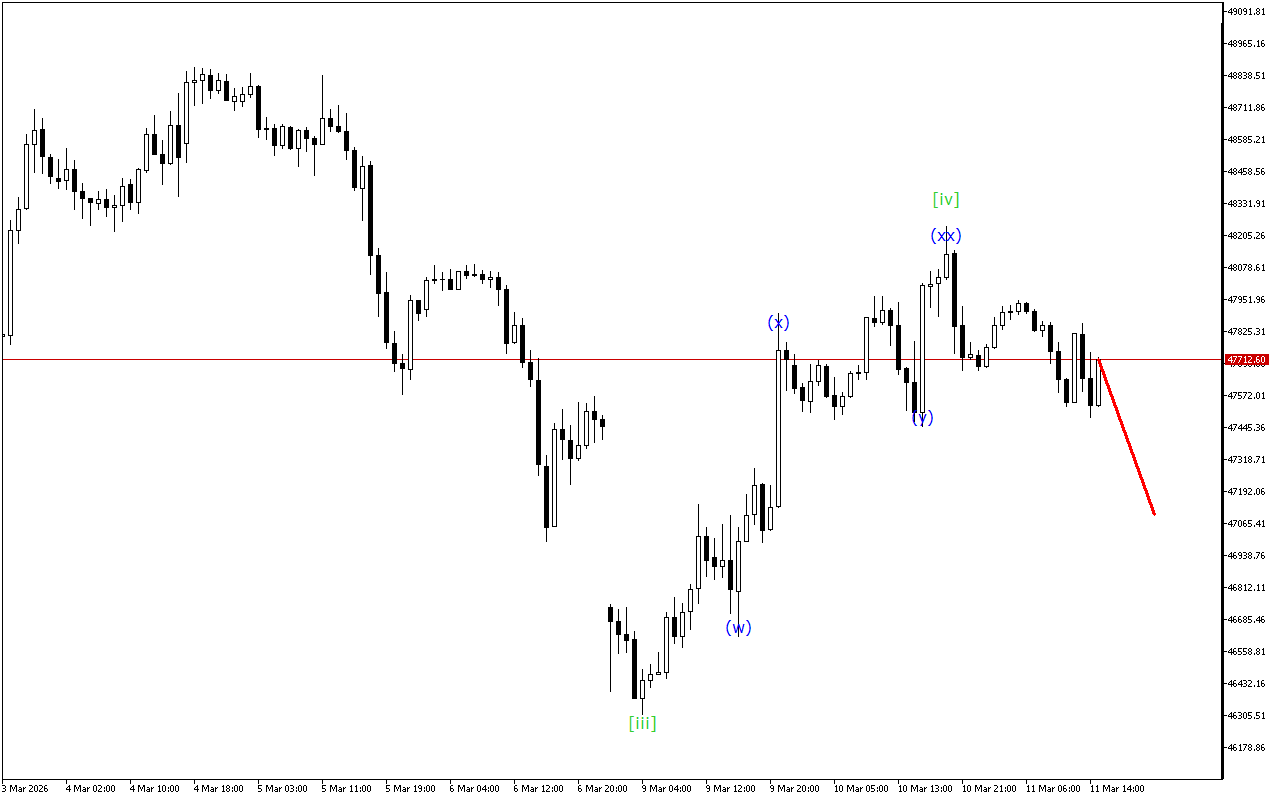
Despite the steady decline in price, the Dow Jones chart is giving signals about a possible completion of the current bearish momentum.Dow Jones continues to move within the Triple Three…


Despite the steady decline in price, the Dow Jones chart is giving signals about a possible completion of the current bearish momentum.Dow Jones continues to move within the Triple Three…
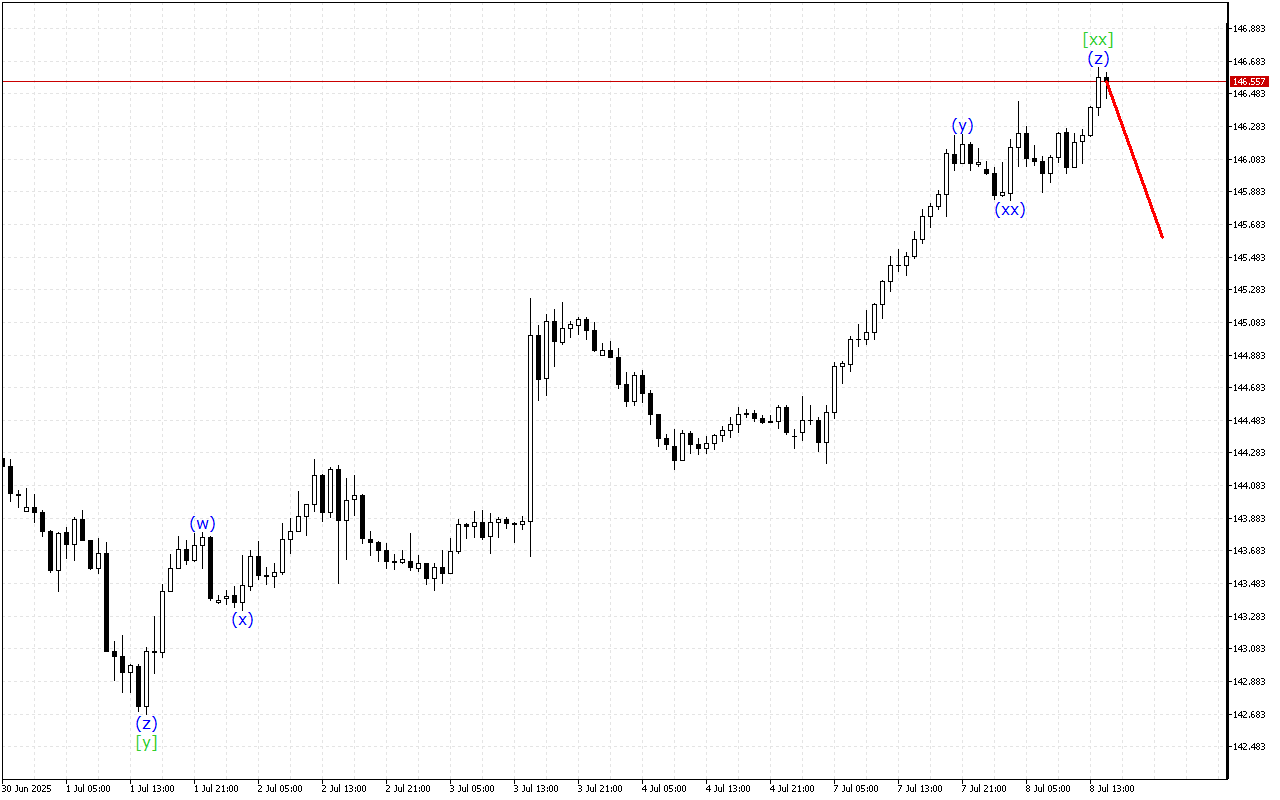
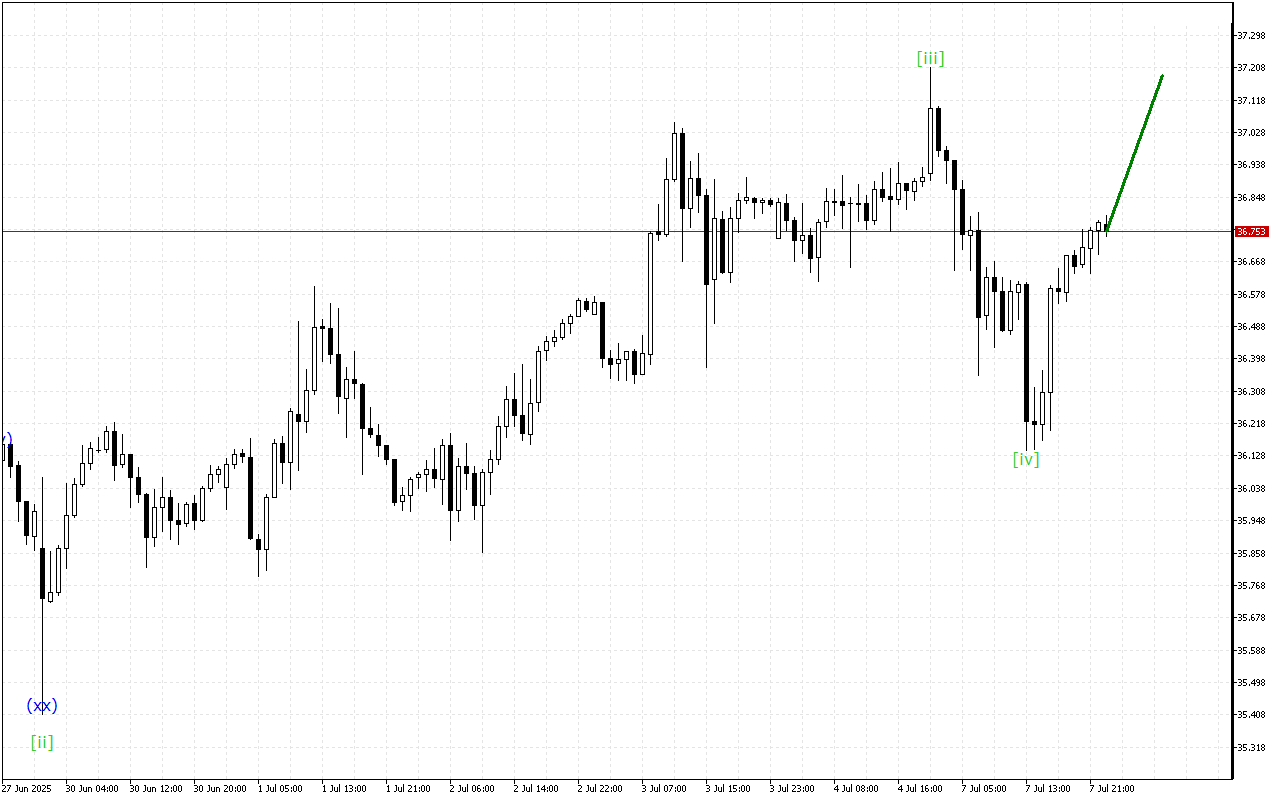
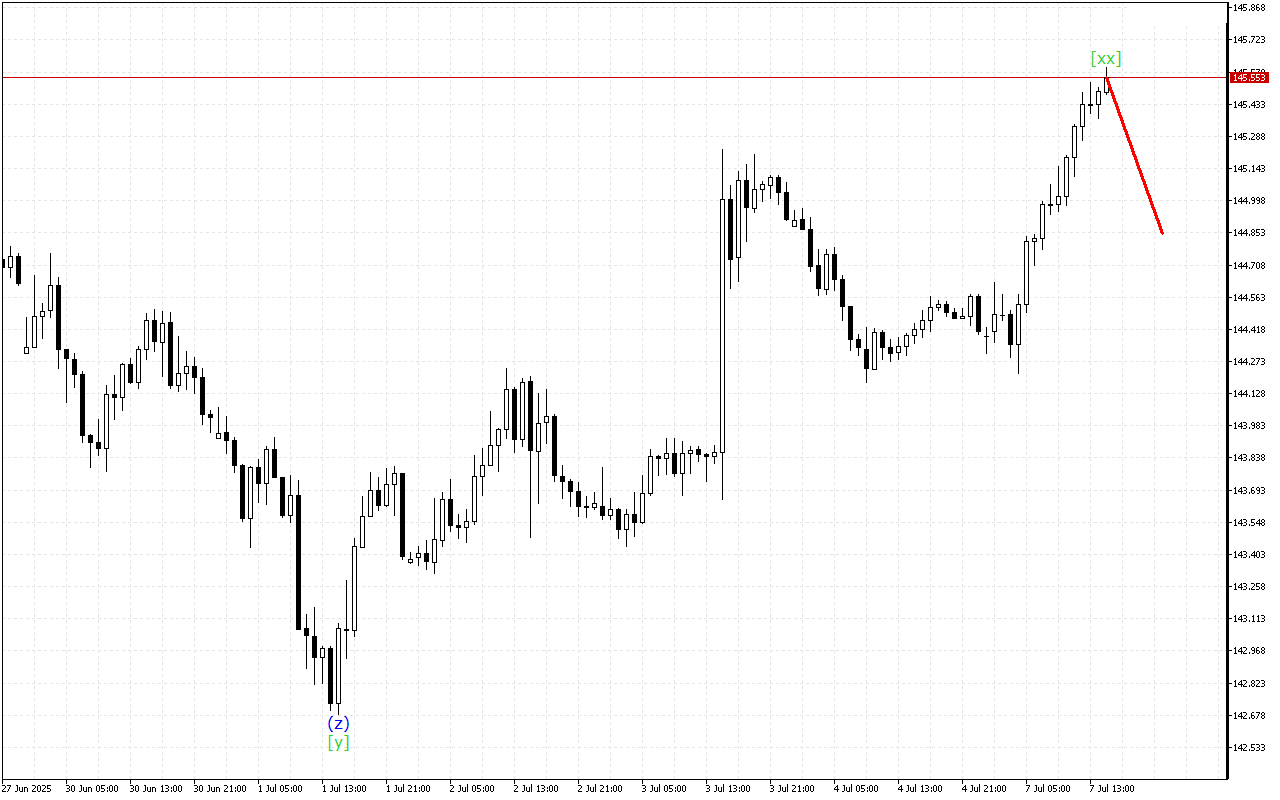
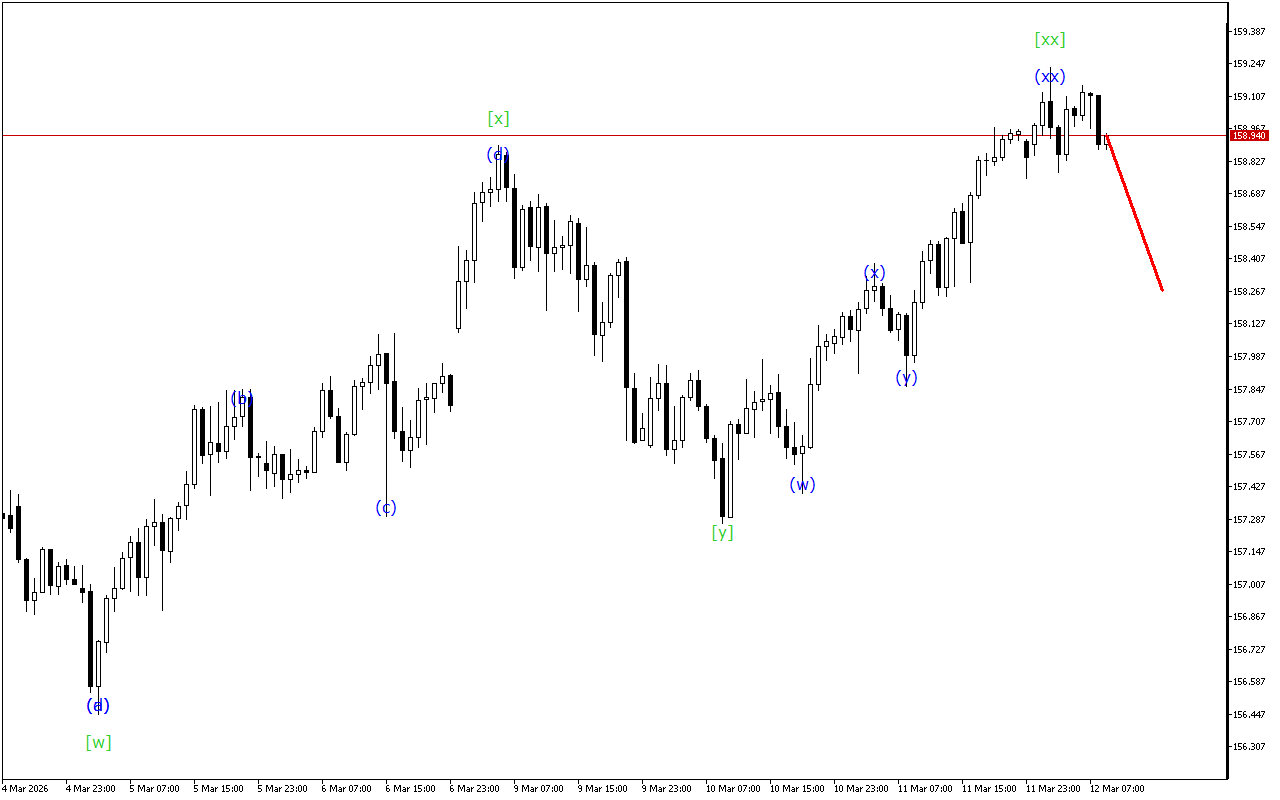
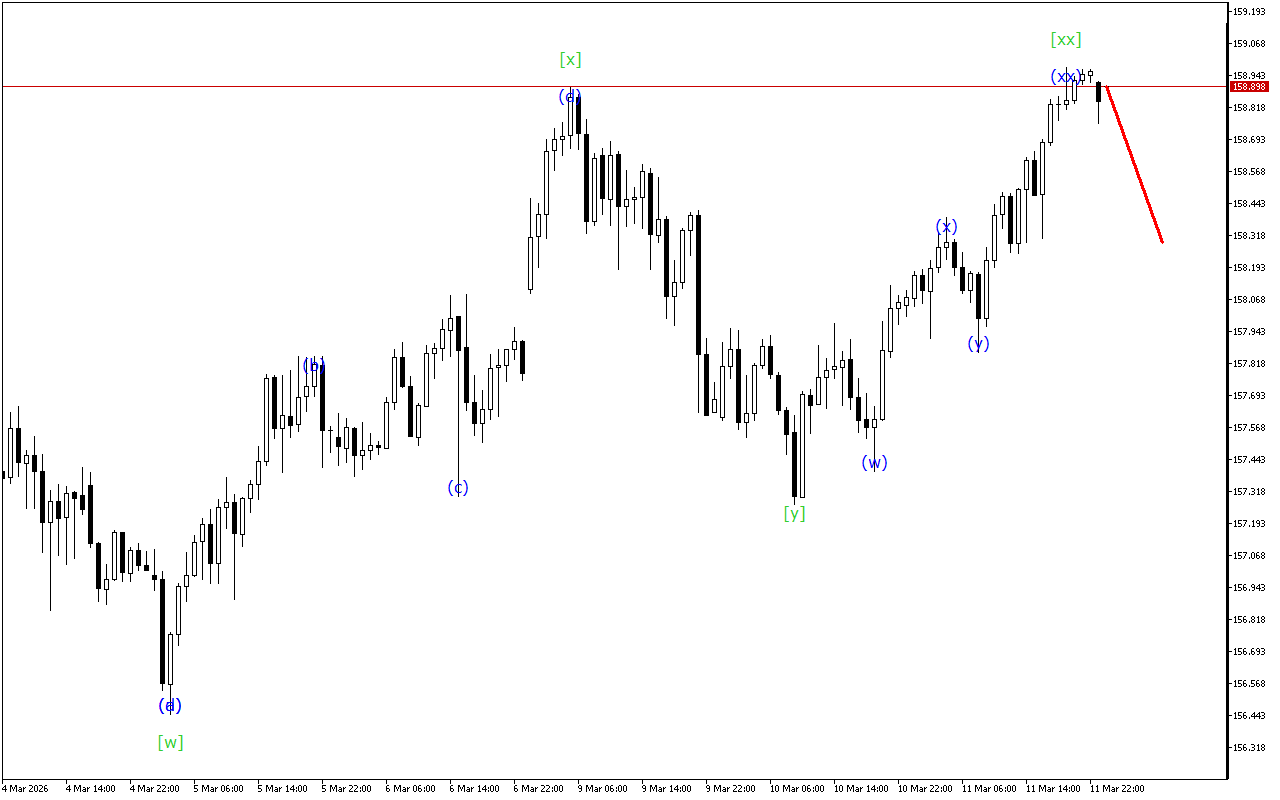
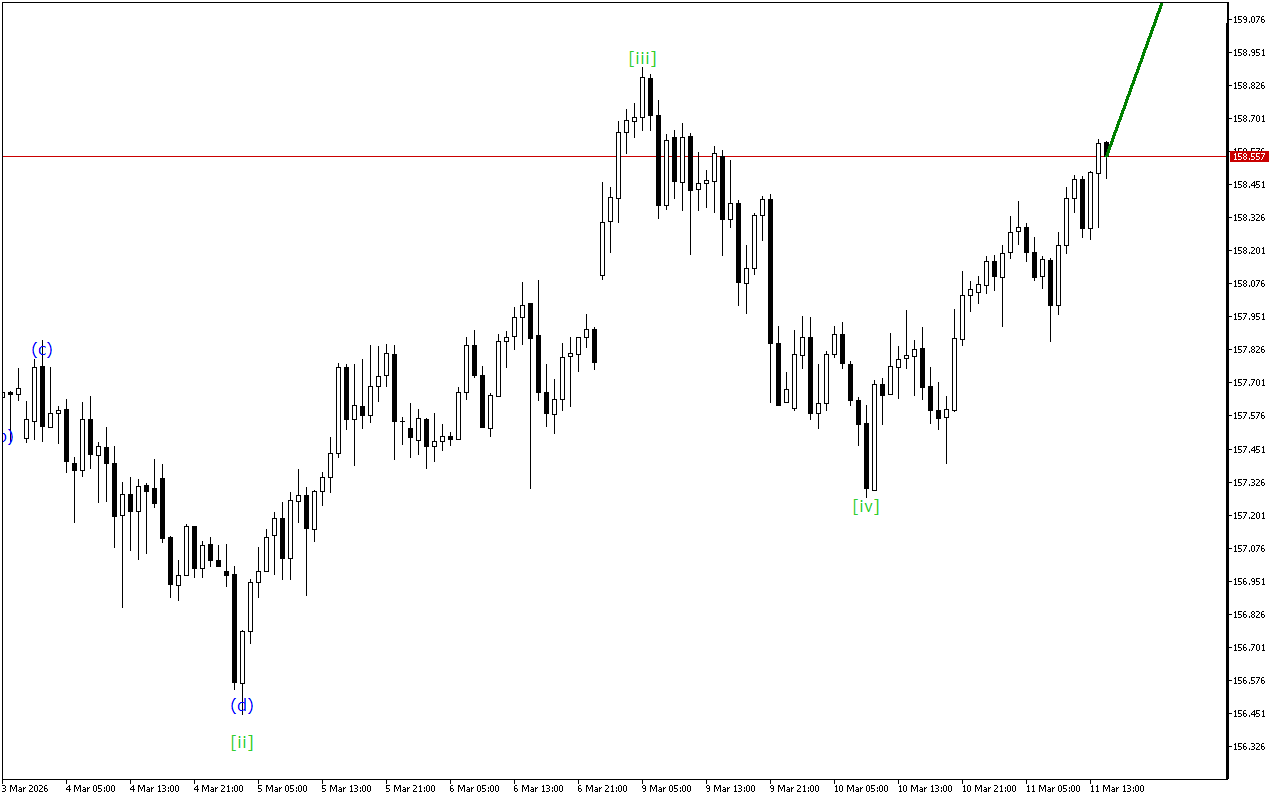
Amid general upward trend continuation, there are emerging signals pointing to a possible completion of the current uptrend in USDJPY.The current dynamics of the movement indicate the formation of a…
Despite the decline, there are signals on the Dow Jones chart indicating a possible upcoming change in direction.The medium-term movement vector of Dow Jones indicates the formation of a Triple…
Although the market maintains an upward momentum prevalence, the USDJPY chart shows signs of a possible end to this trend.The current dynamics of the movement indicate the formation of a…
The market remains in a downtrend, though wave analysis indicates a potential end to the current trend.The medium-term movement vector of Dow Jones indicates the formation of a Triple Three…
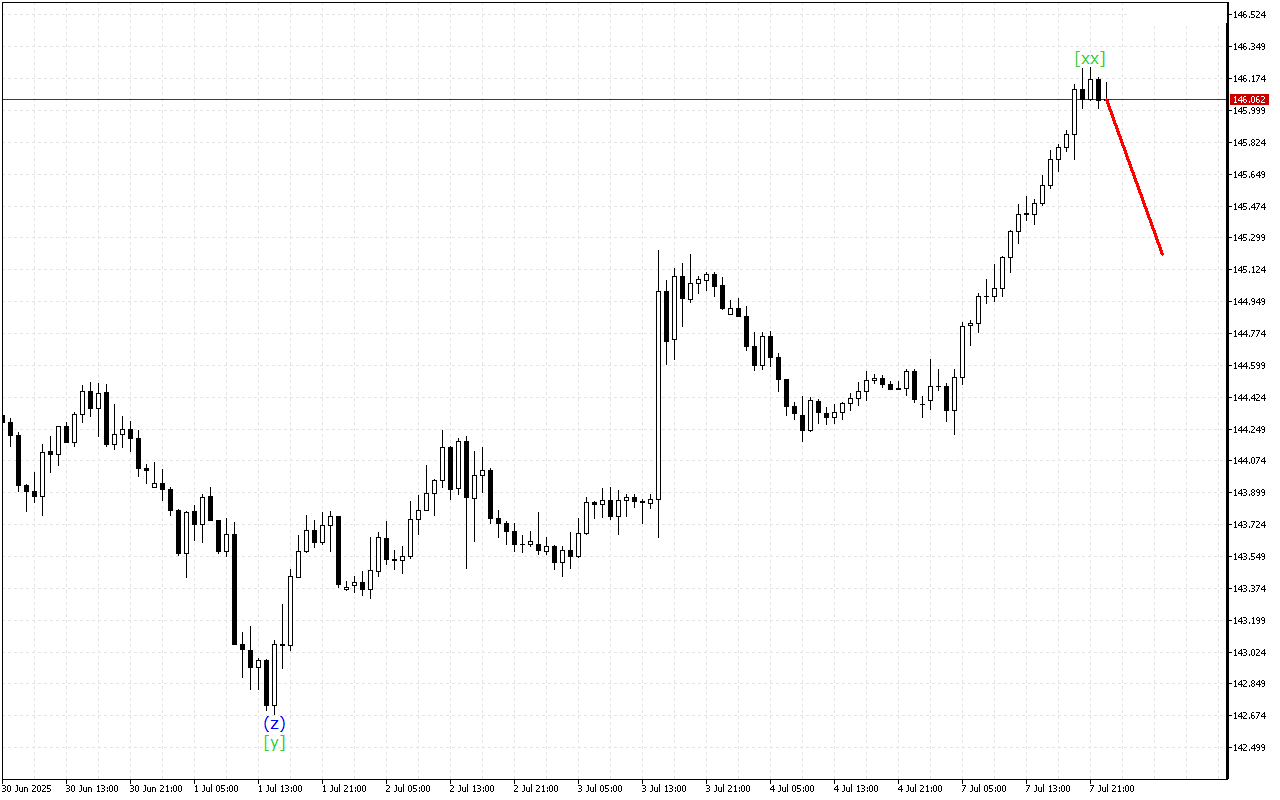
Despite the steady decline in price, the XAGUSD chart is giving signals about a possible completion of the current bearish momentum.The higher-degree wave structure resembles a rising wedge. Within this…
Amid general upward trend continuation, there are emerging signals pointing to a possible completion of the current uptrend in USDJPY.There is the development of a triple three wave structure on…
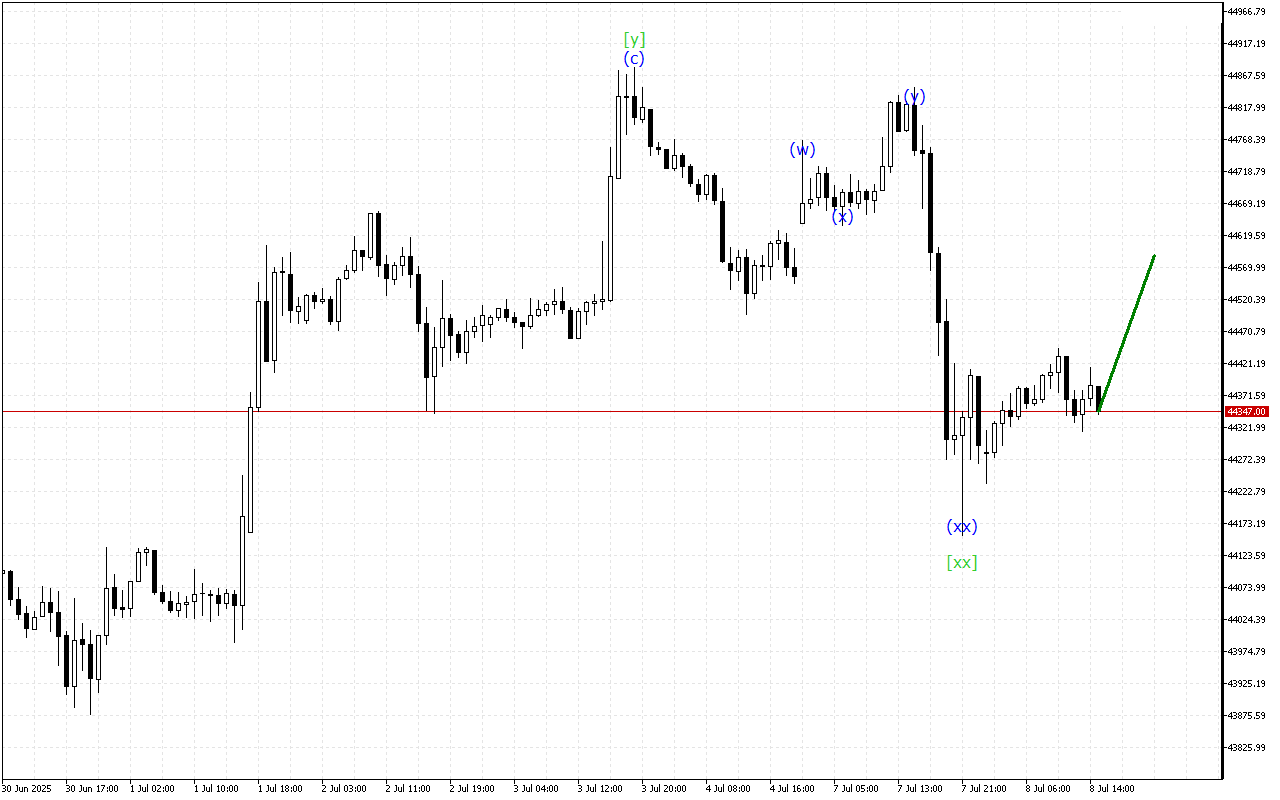
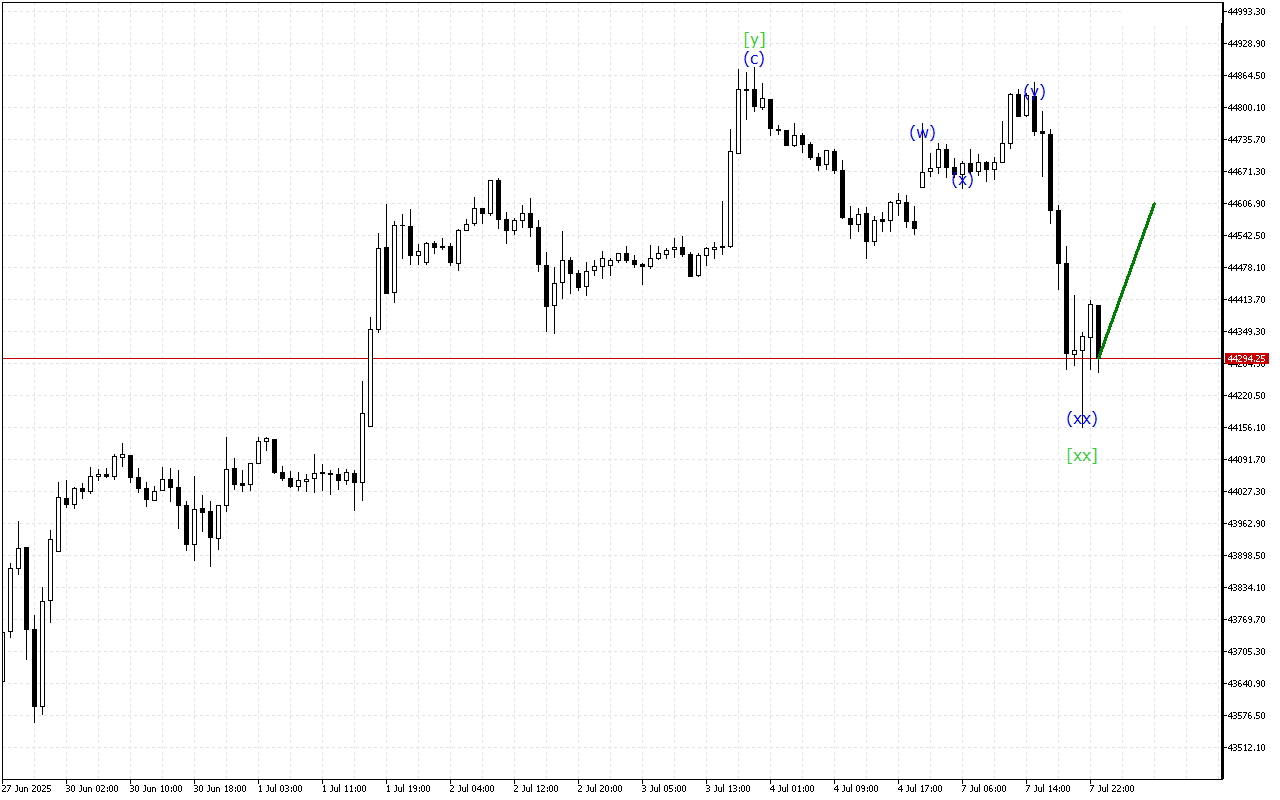
The market is still heading down, but the chart shows signs that the current trend will end soon.The medium-term movement vector of Dow Jones indicates the formation of a Triple…
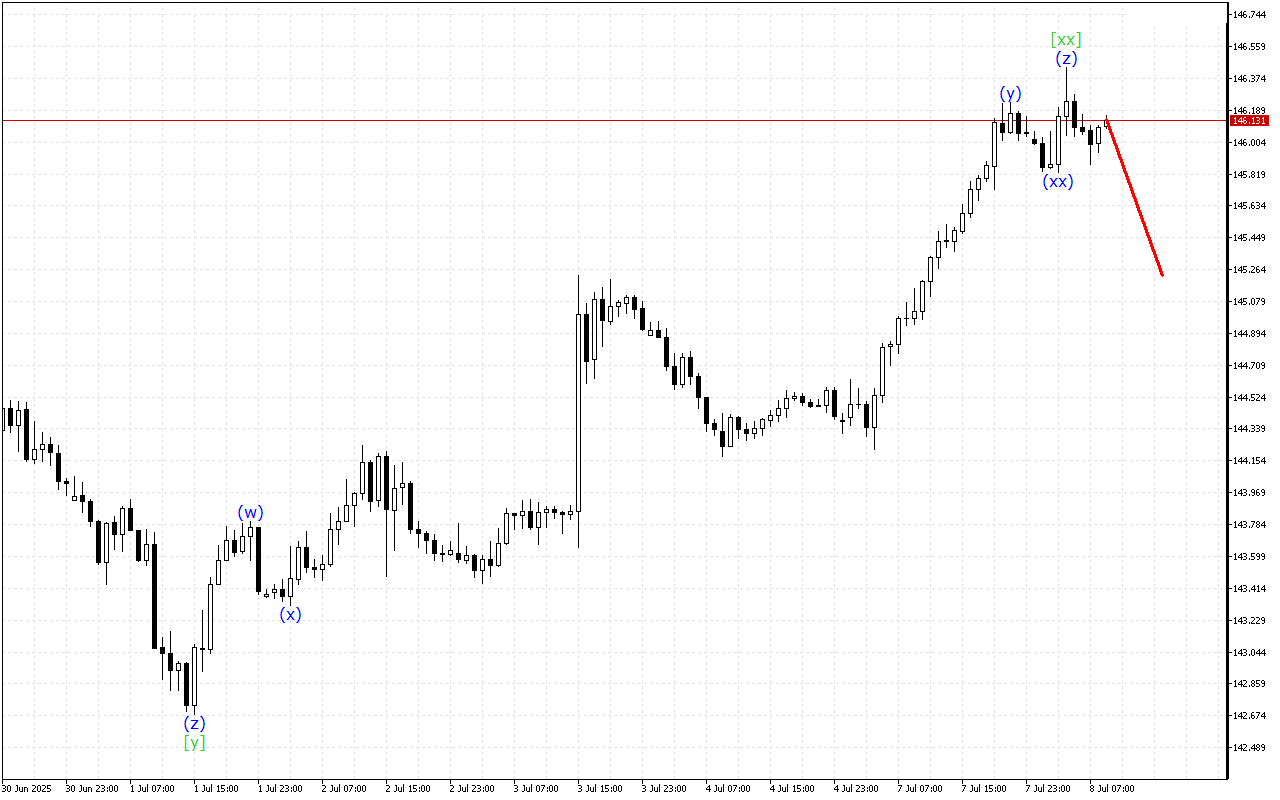
Although the market maintains an upward momentum prevalence, the USDJPY chart shows signs of a possible end to this trend.There is the development of a triple three wave structure on…
Although the market maintains an upward momentum prevalence, the Dow Jones chart shows signs of a possible end to this trend.The current dynamics of the movement indicate the formation of…