

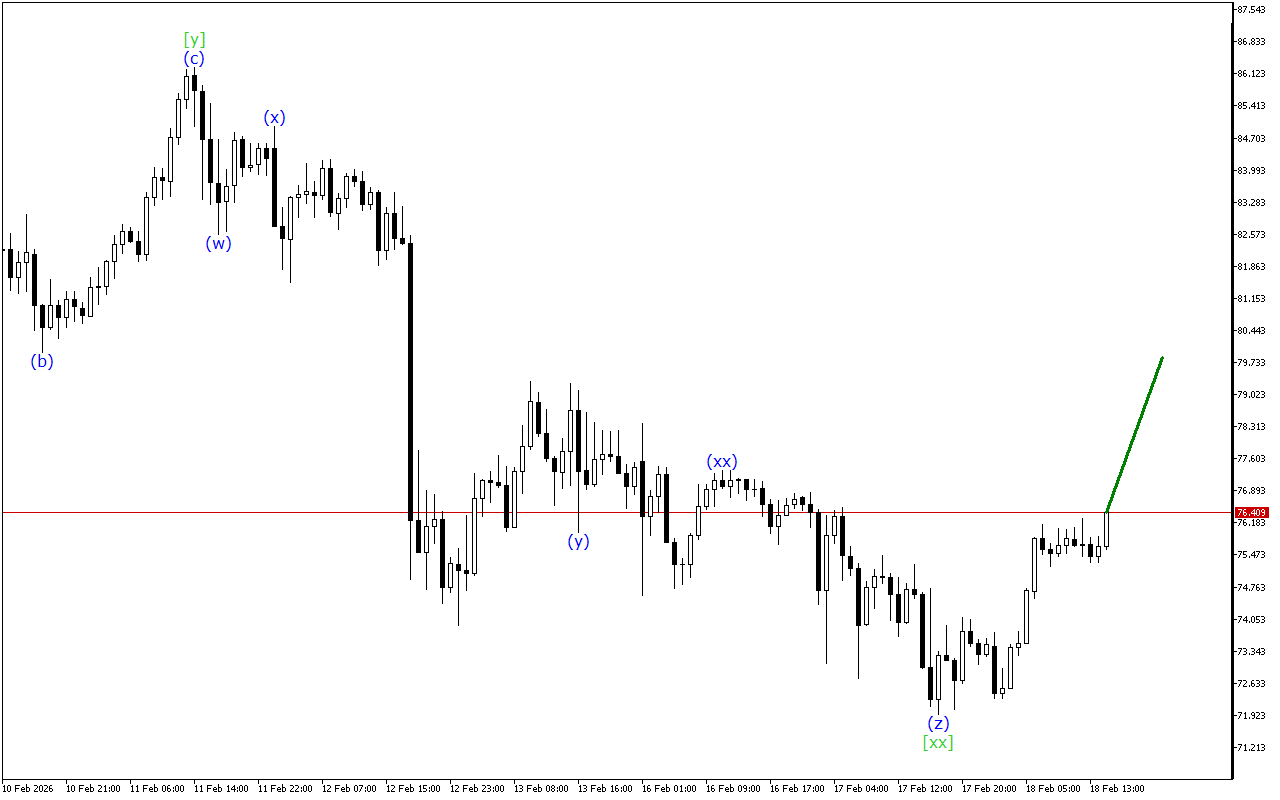
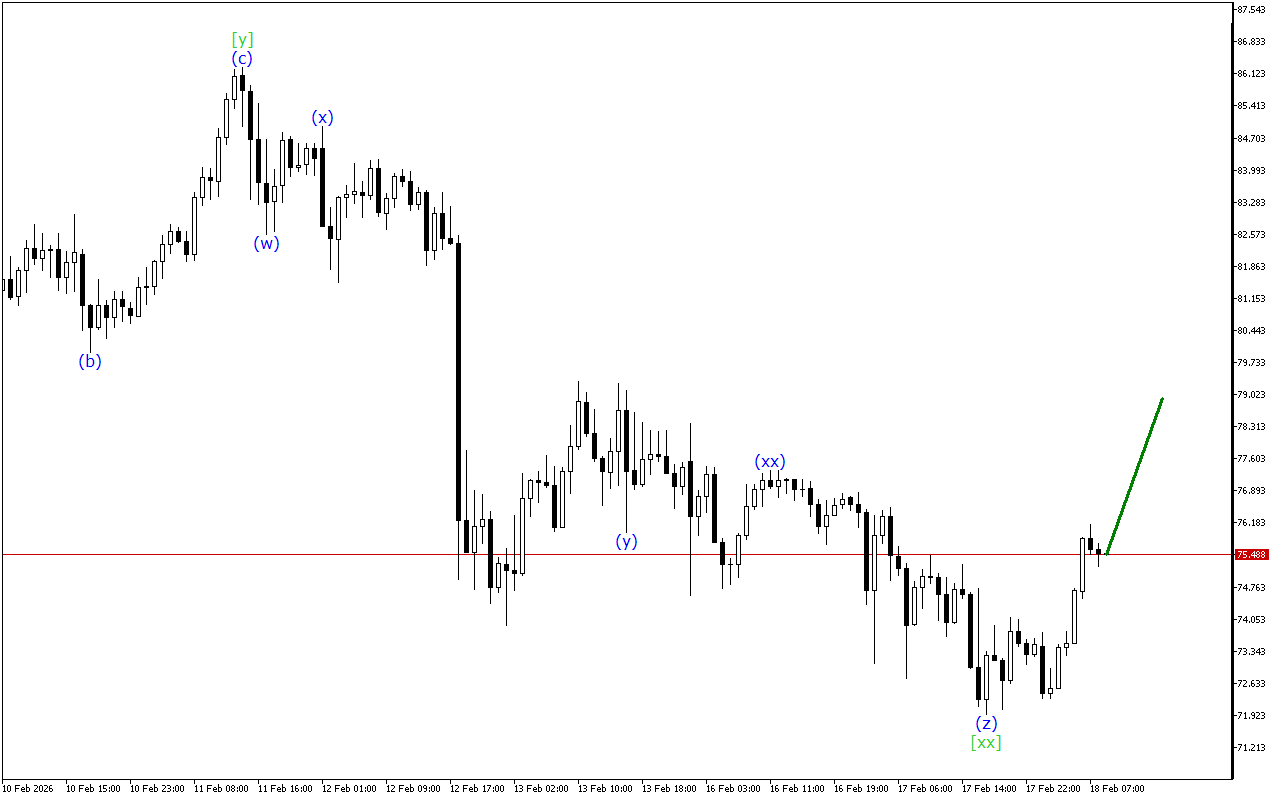
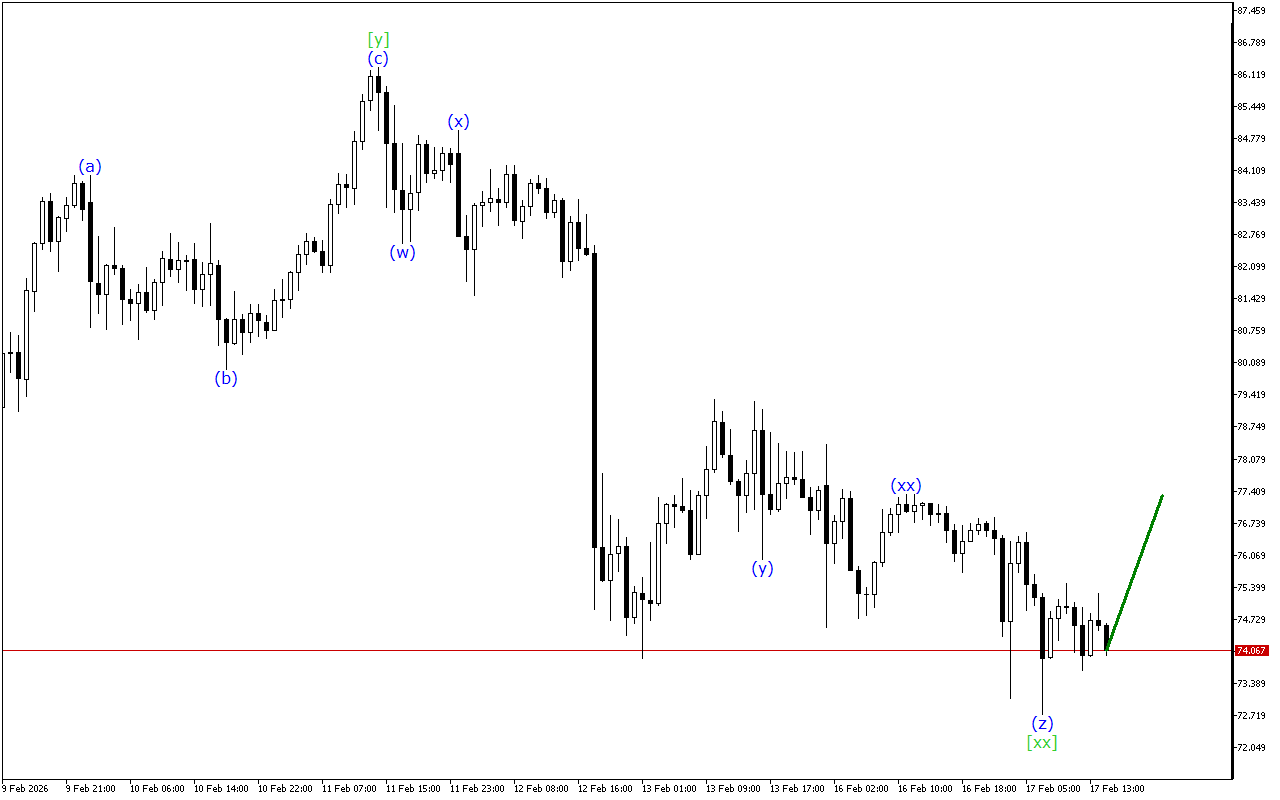
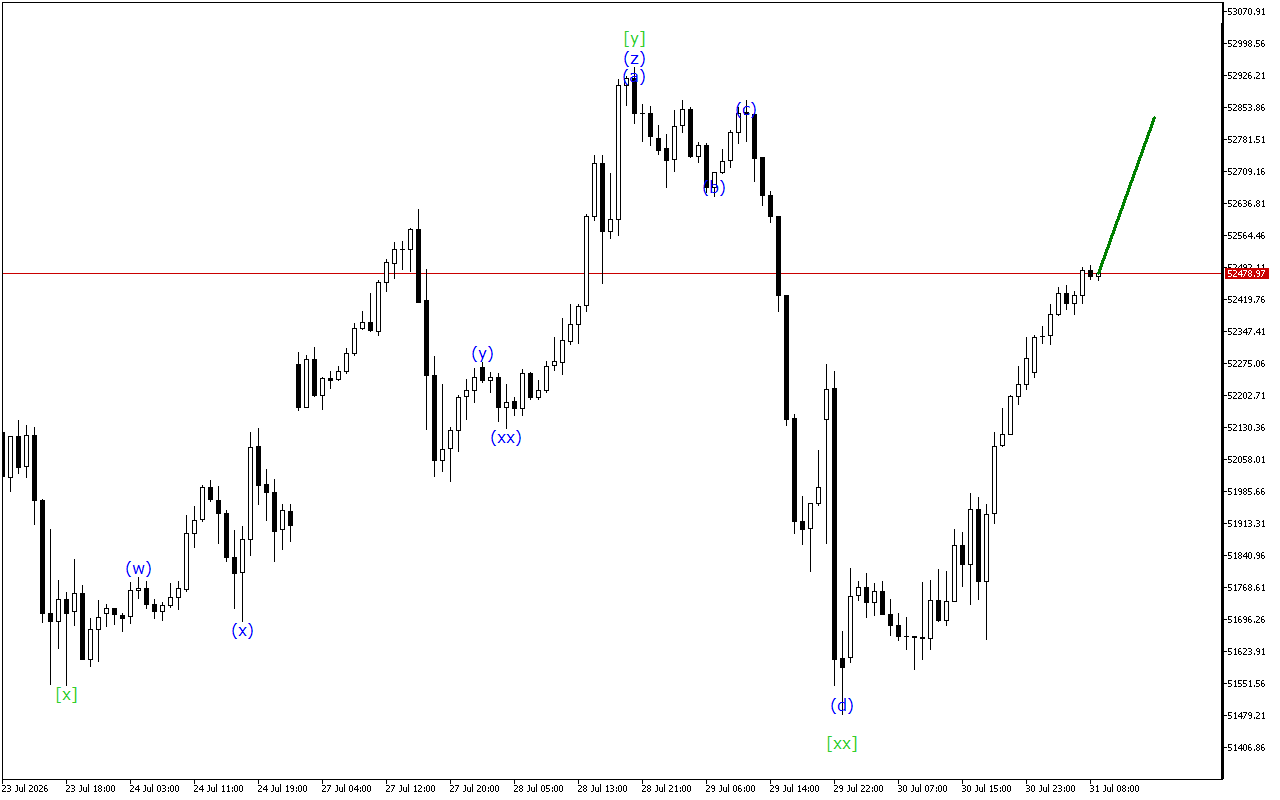
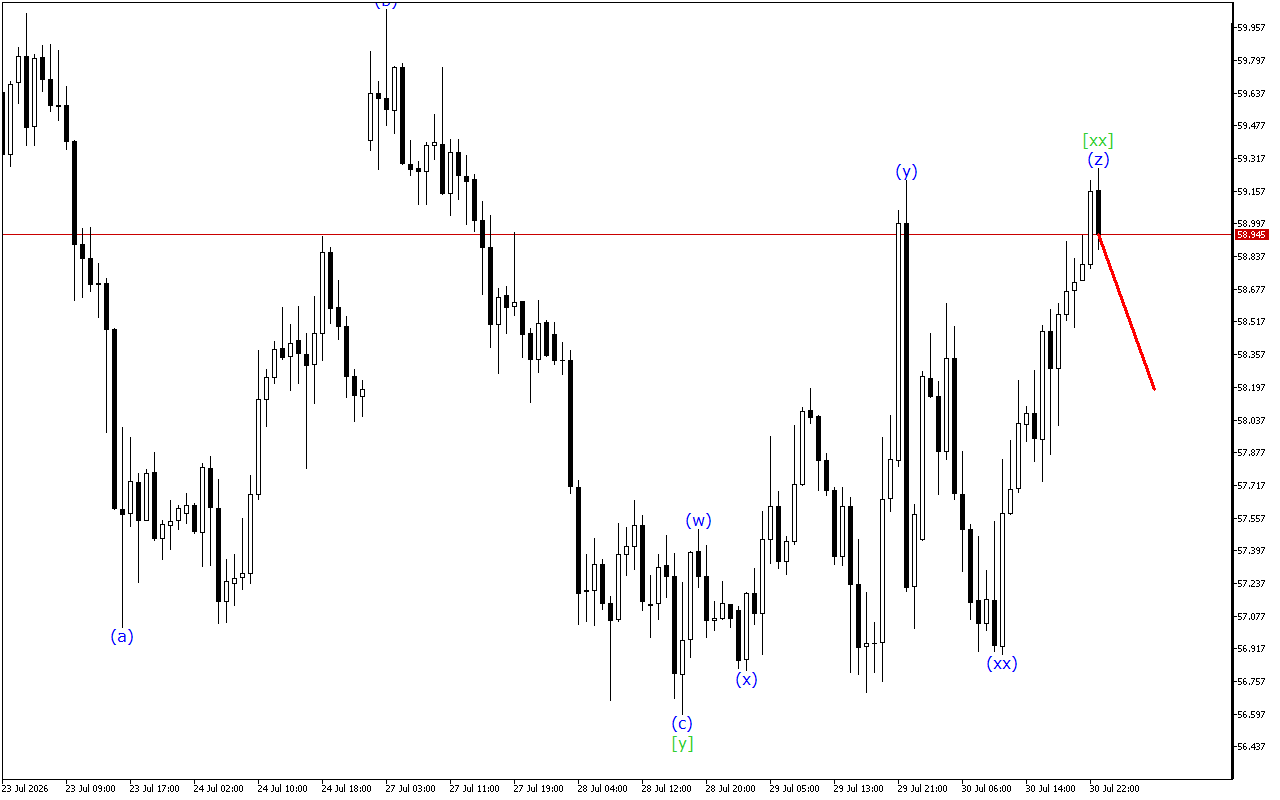
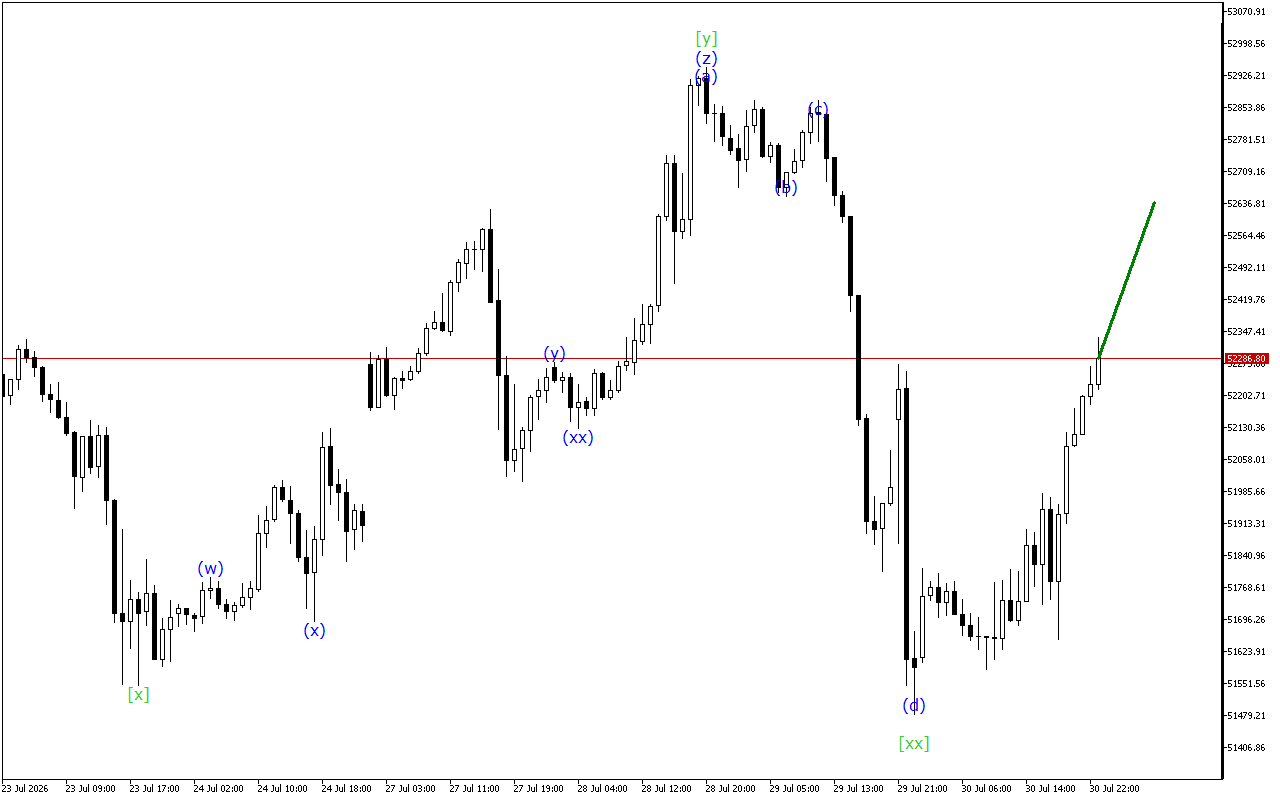
XAGUSD H1: Wave Analysis for the American Session on 18.2.2026
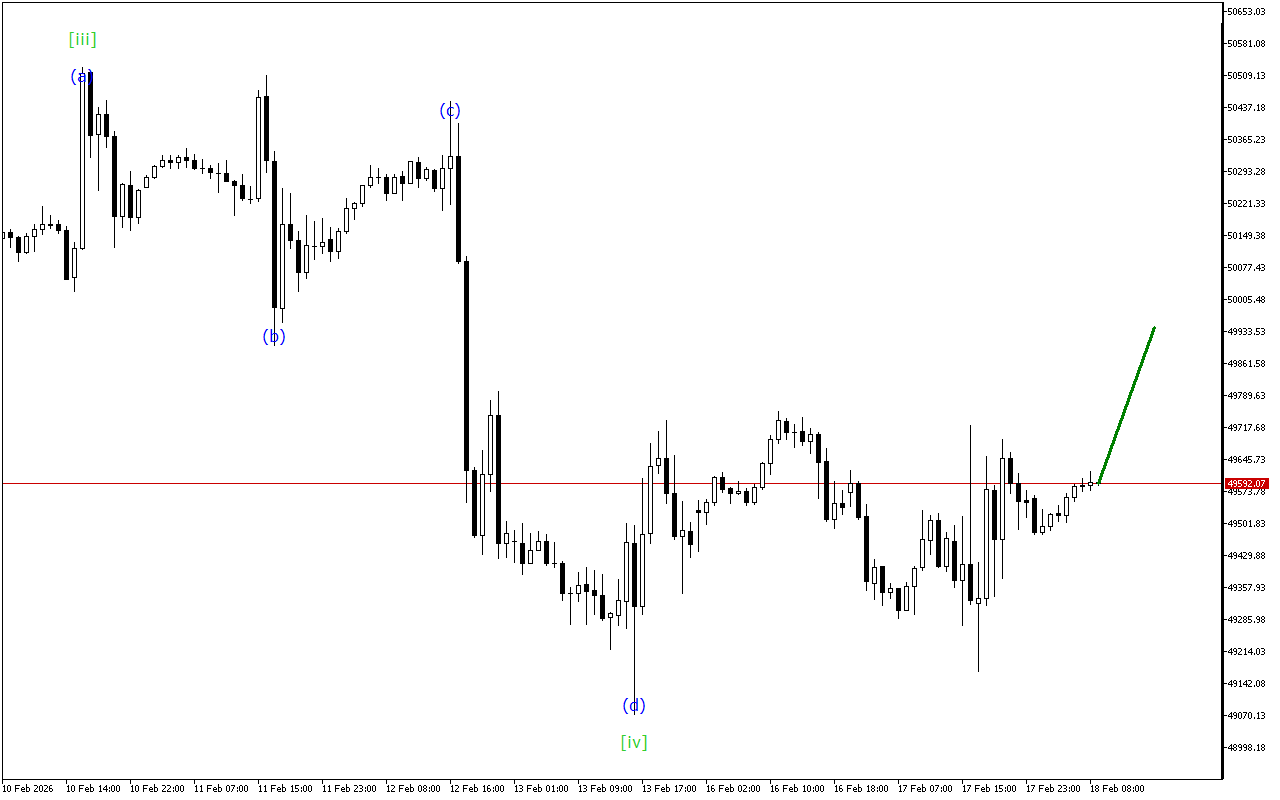
The market remains in a downtrend, though wave analysis indicates a potential end to the current trend.XAGUSD continues to move within the Triple Three wave structure. Now, apparently, the formation…