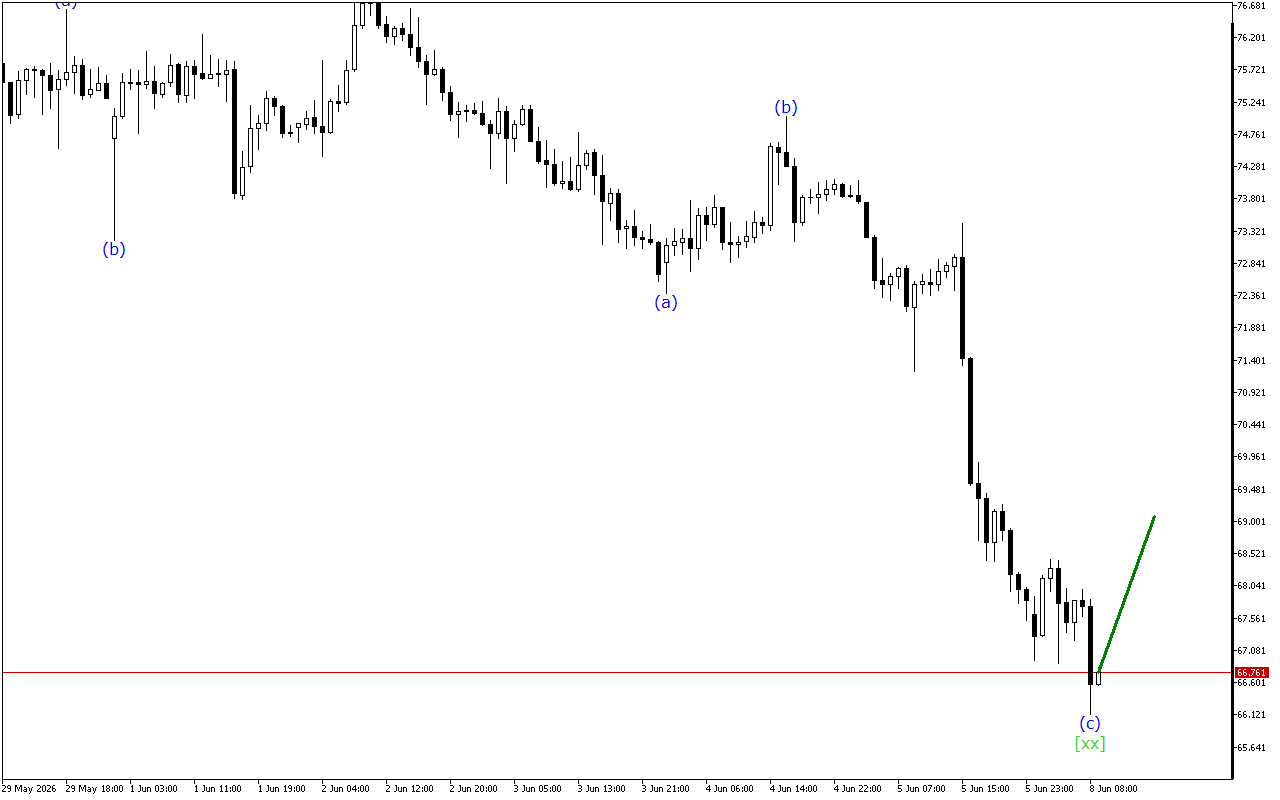
XAGUSD H1: Wave Analysis for the European Session on 8.6.2026
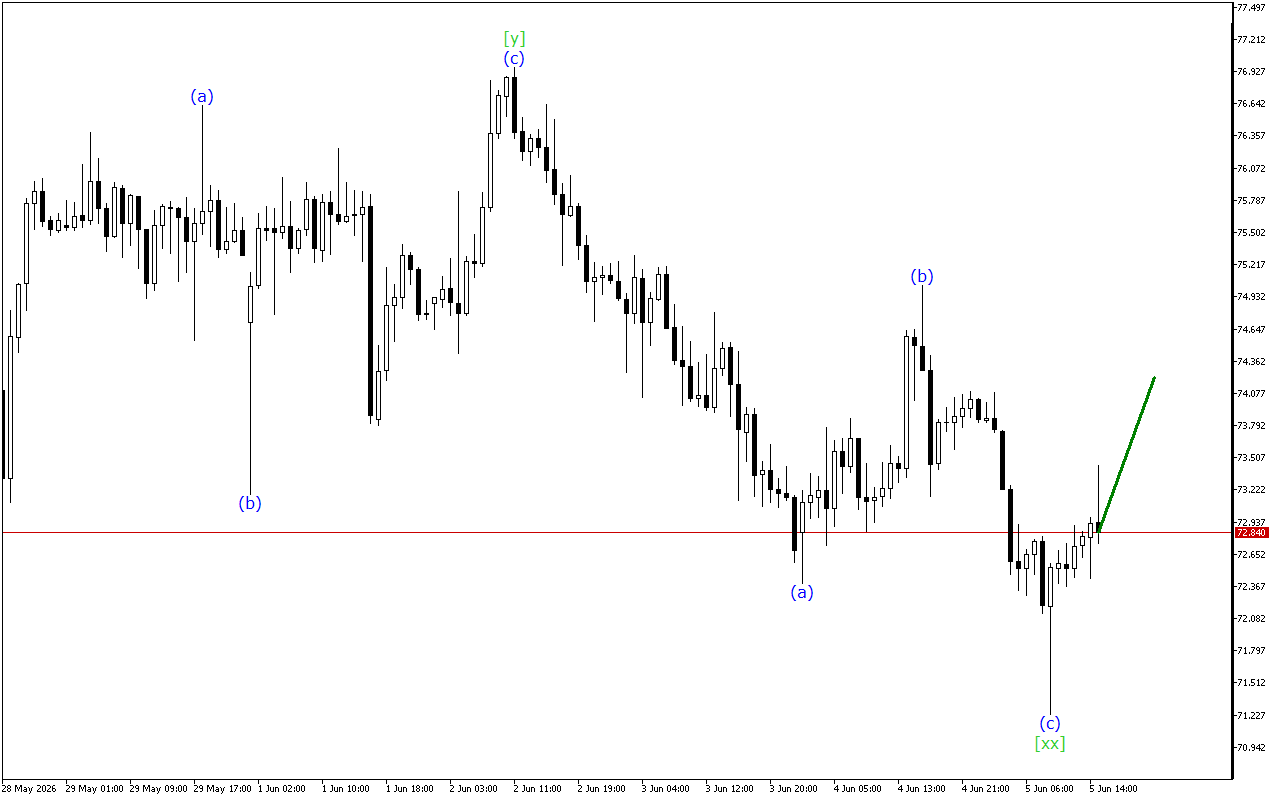
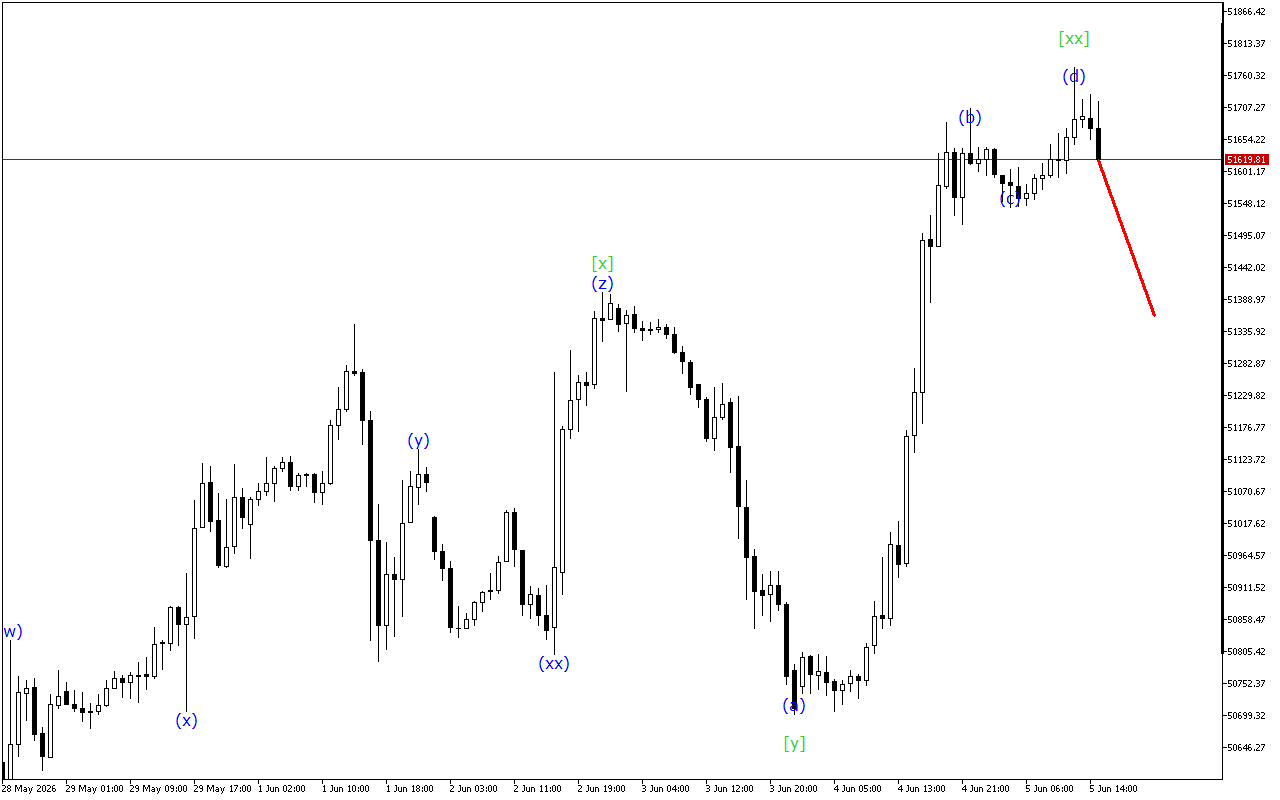
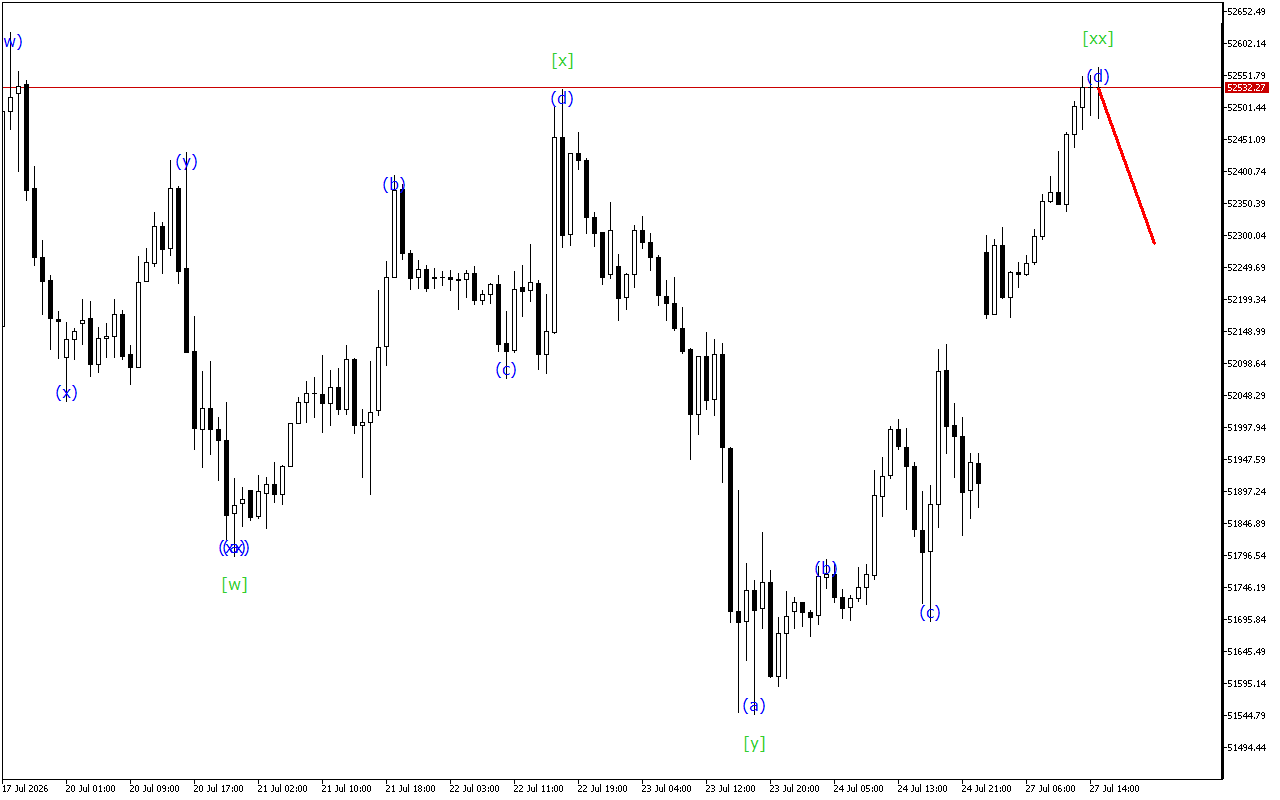
The price continues to move down, but the XAGUSD chart shows signs that the downward momentum is likely to end soon.XAGUSD continues to move within the Triple Three wave structure.…


2862
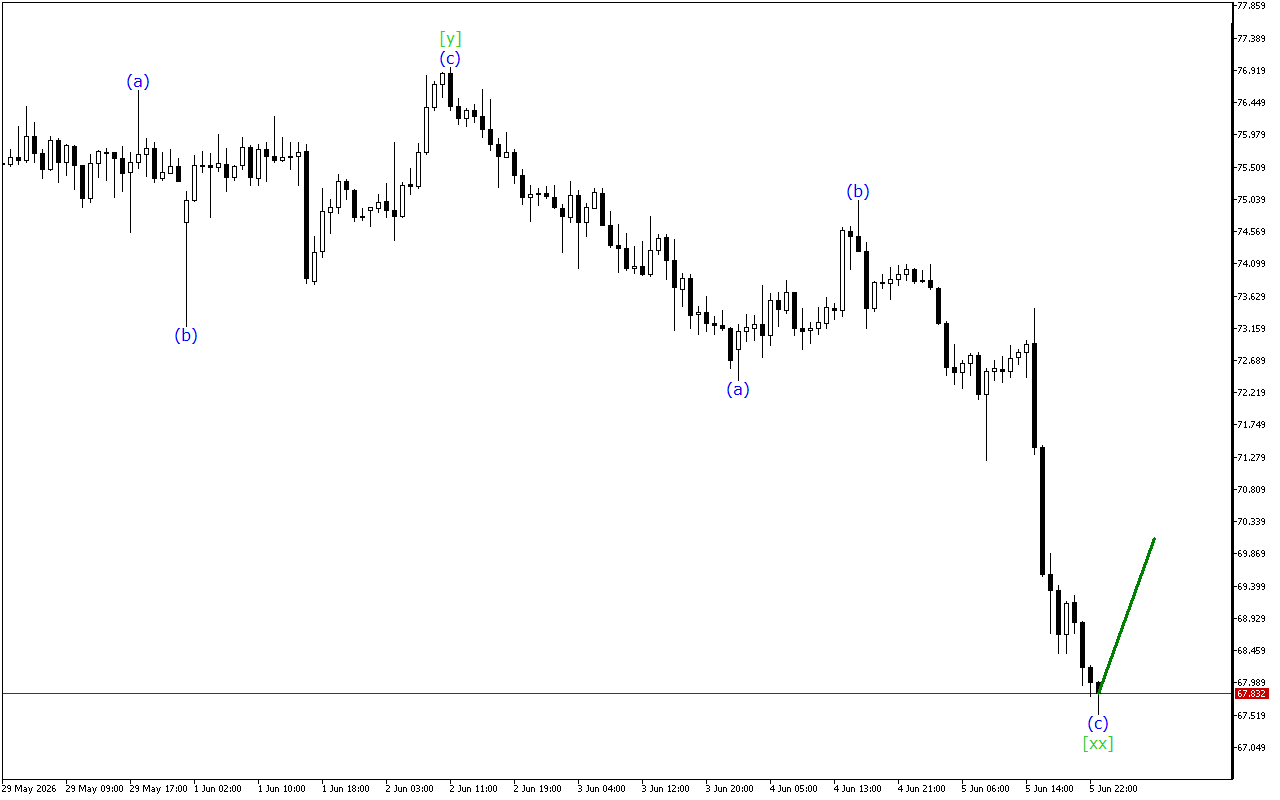
The price continues to move down, but the XAGUSD chart shows signs that the downward momentum is likely to end soon.XAGUSD continues to move within the Triple Three wave structure.…
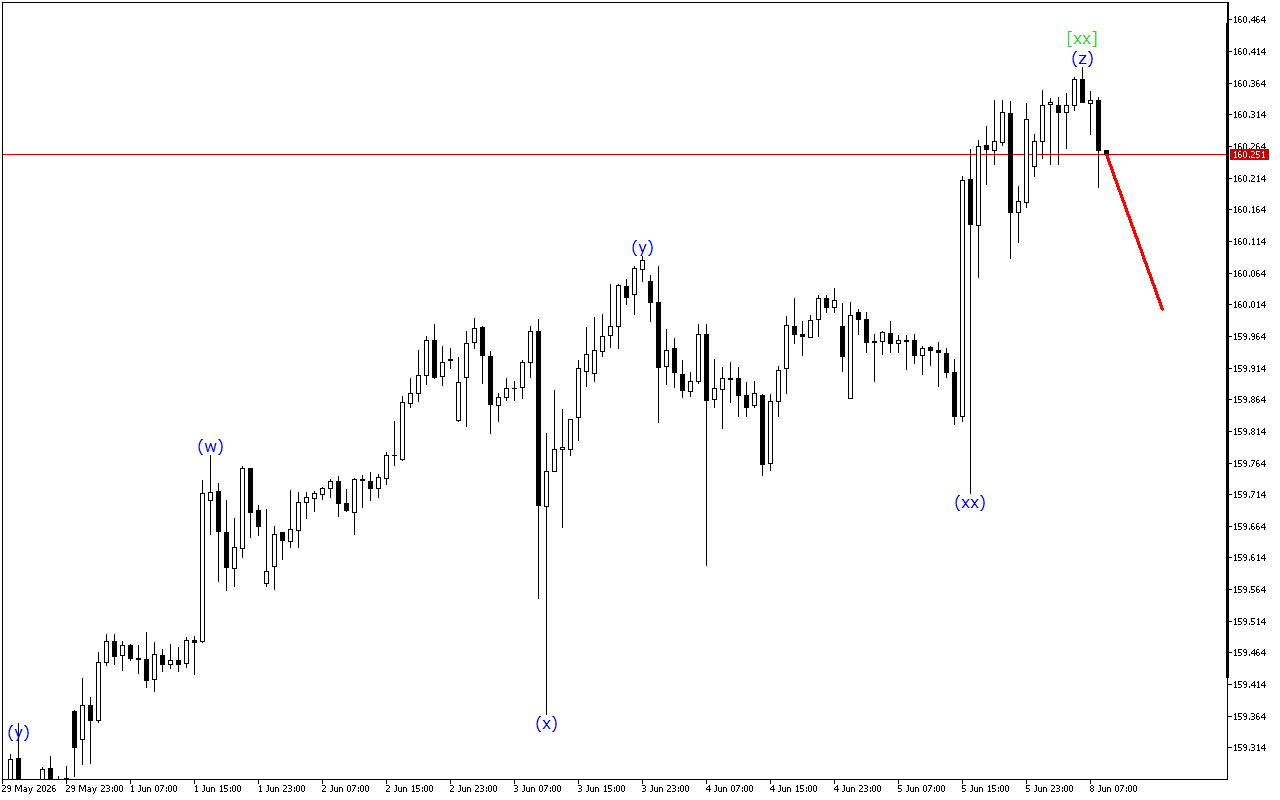
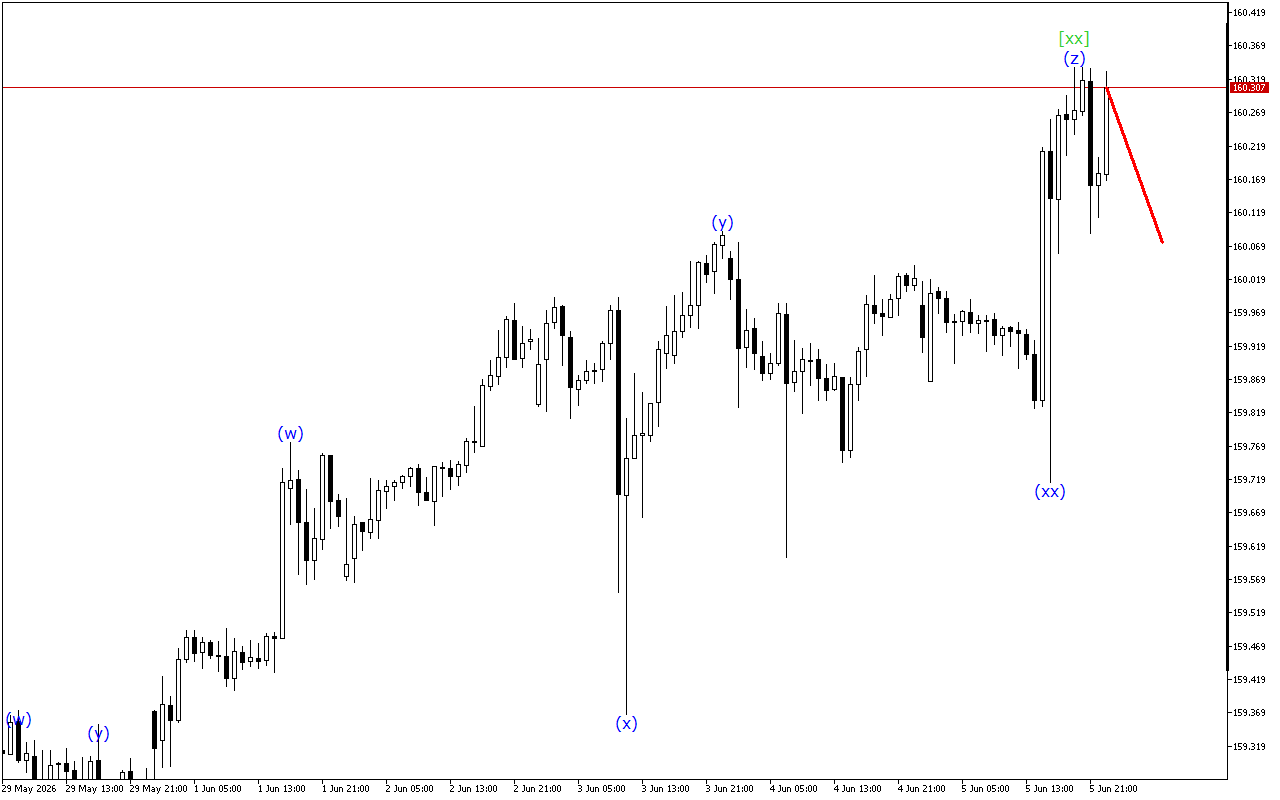
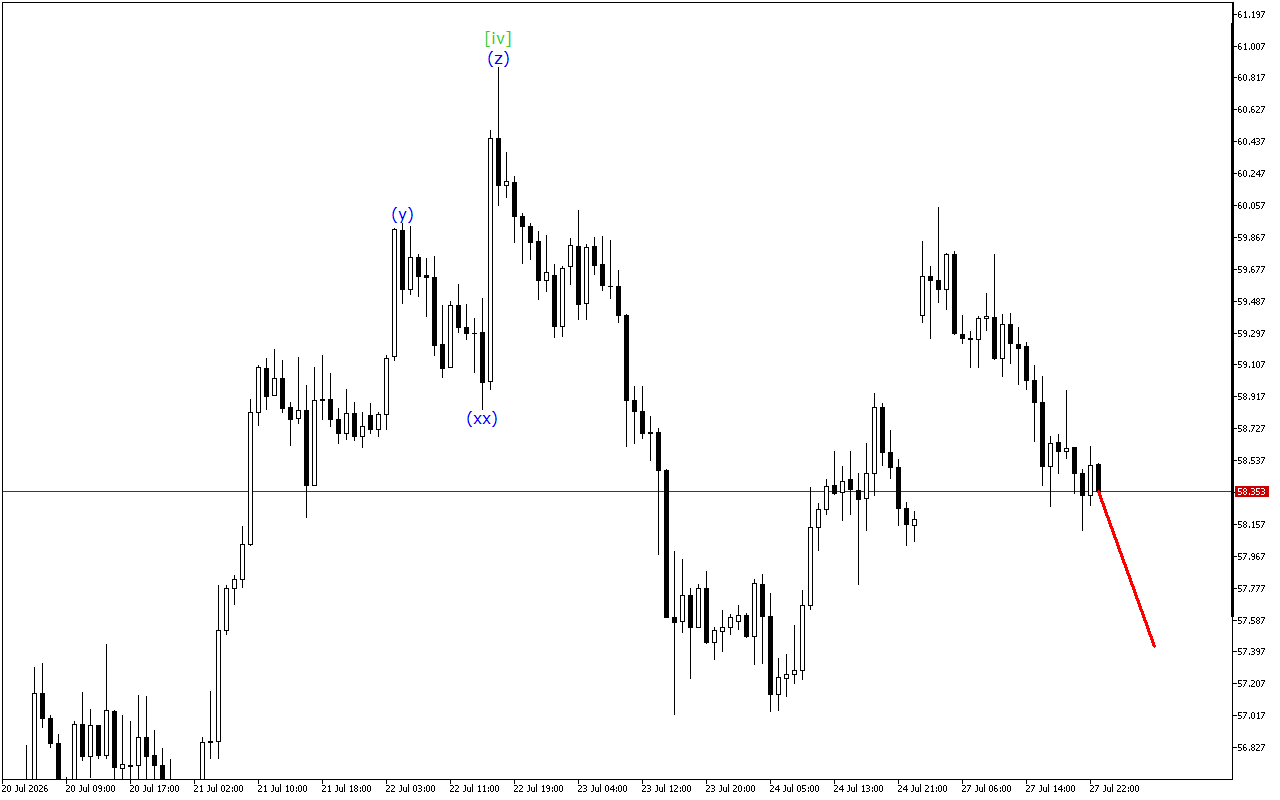
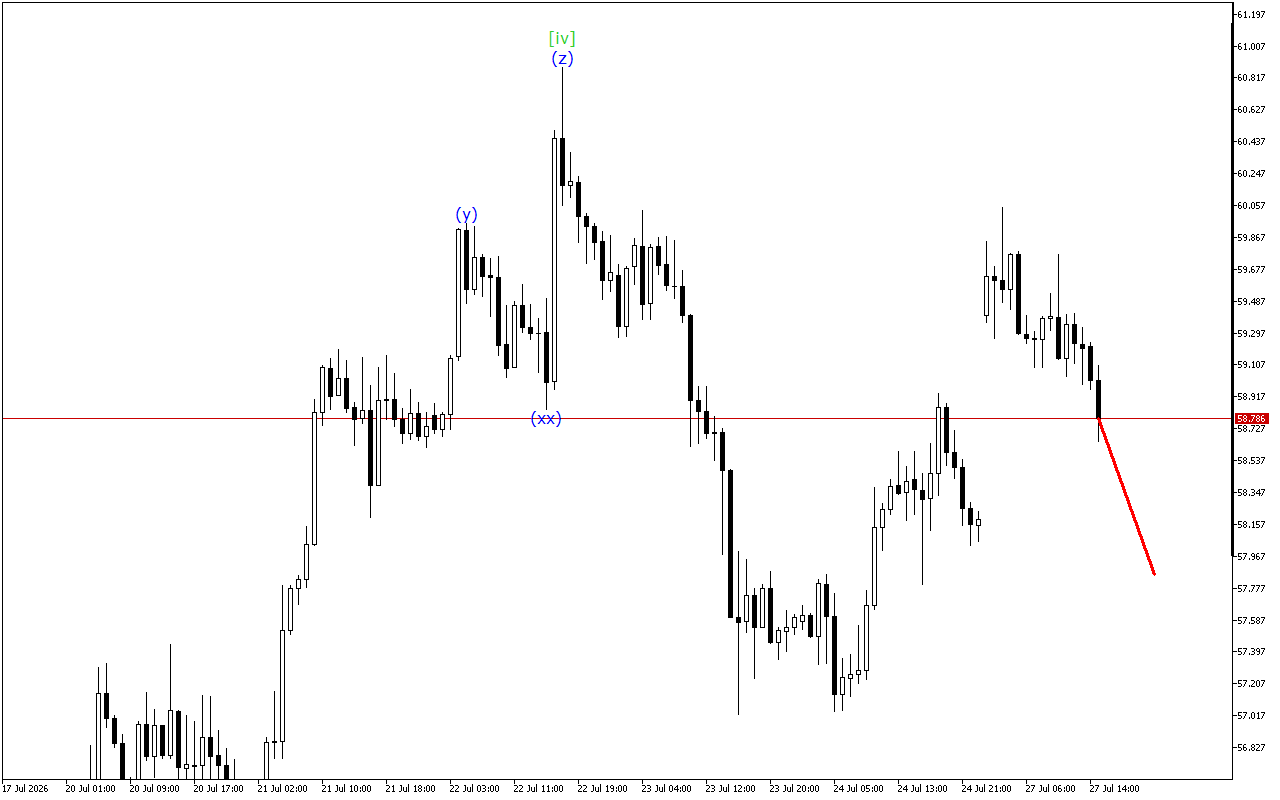
Although the market maintains an upward momentum prevalence, the USDJPY chart shows signs of a possible end to this trend.The current dynamics of the movement indicate the formation of a…
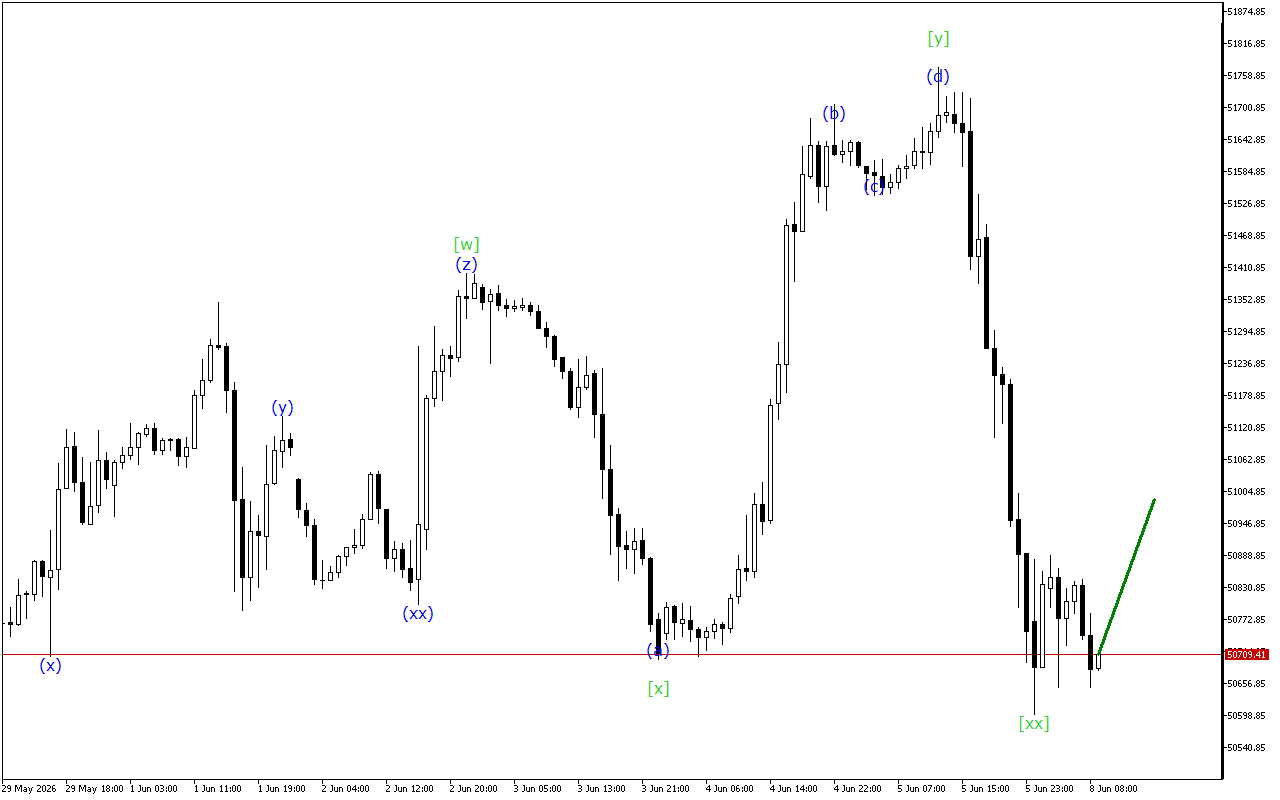
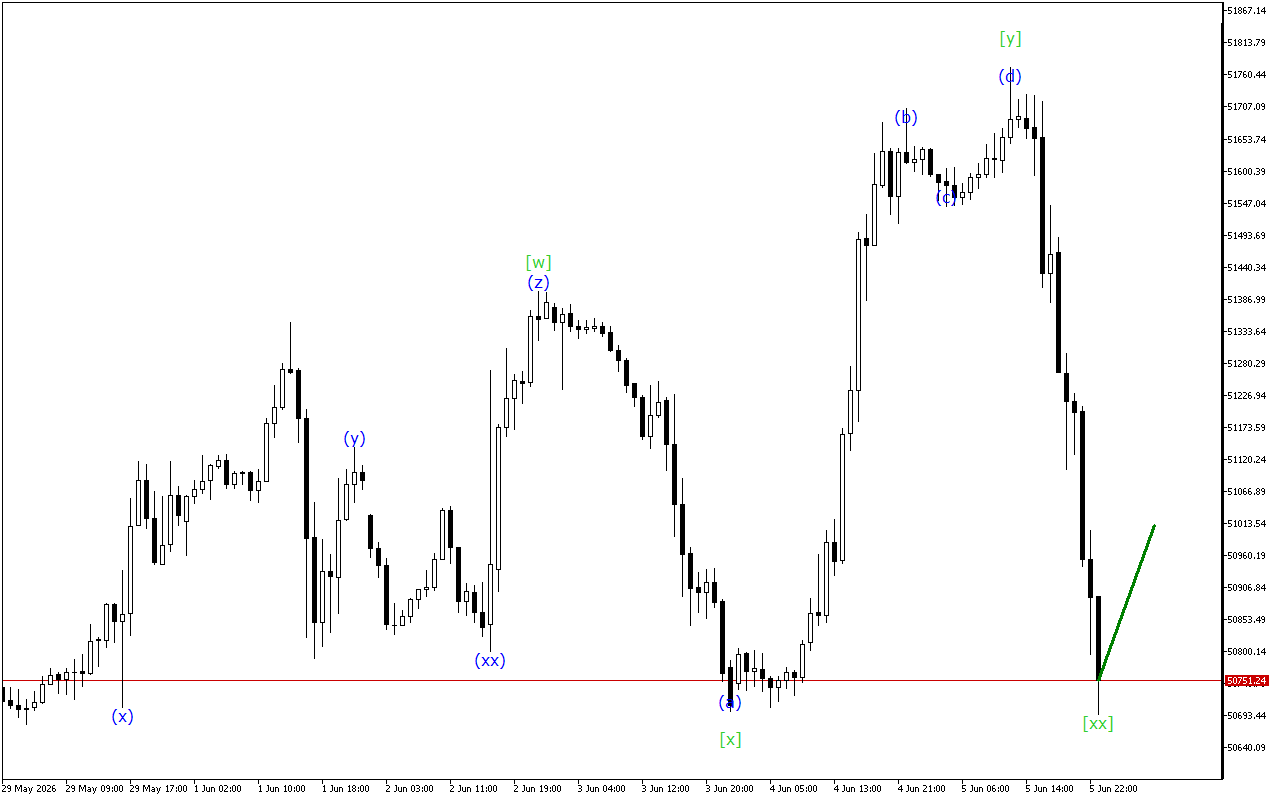
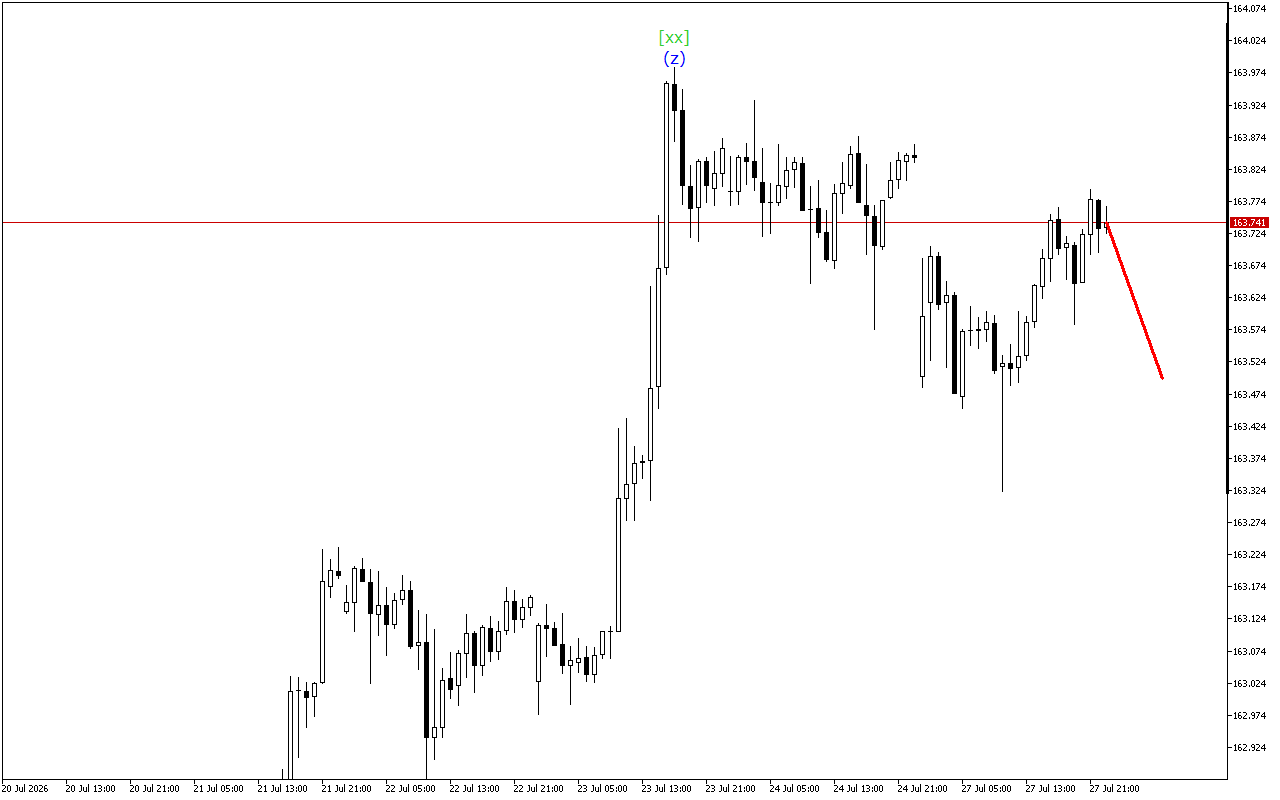
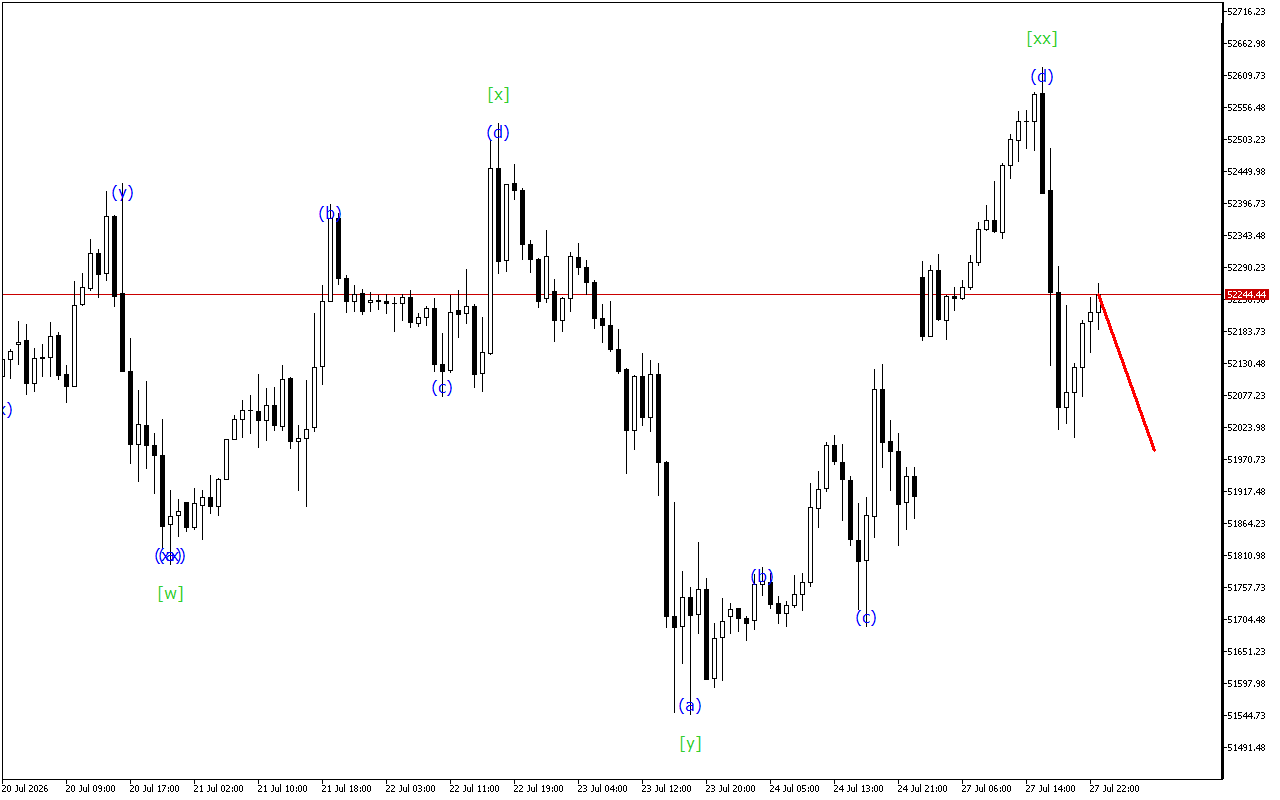
Despite the decline, there are signals on the Dow Jones chart indicating a possible upcoming change in direction.The medium-term movement vector of Dow Jones indicates the formation of a Triple…
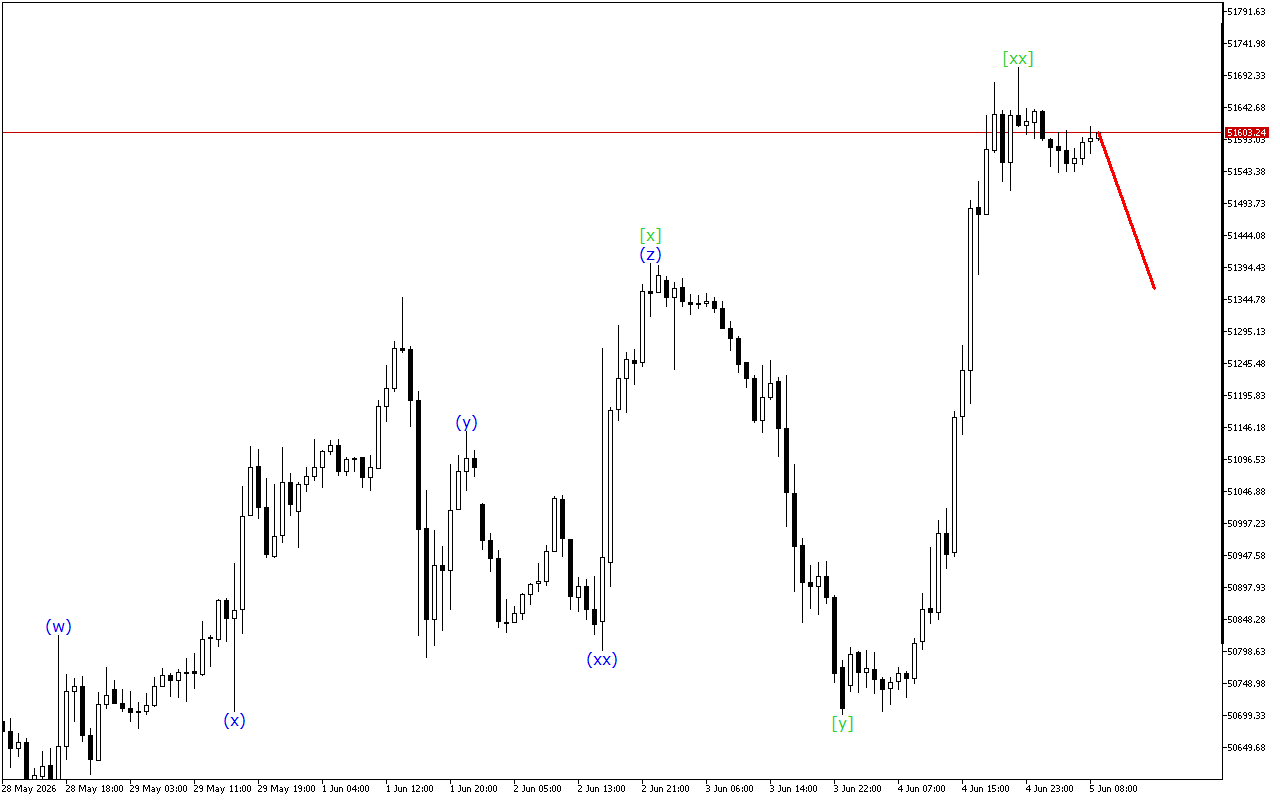
The market is still heading down, but the chart shows signs that the current trend will end soon.XAGUSD continues to move within the Triple Three wave structure. Now, apparently, the…
Although the market maintains an upward momentum prevalence, the USDJPY chart shows signs of a possible end to this trend.There is the development of a triple three wave structure on…
Despite the steady decline in price, the Dow Jones chart is giving signals about a possible completion of the current bearish momentum.The medium-term movement vector of Dow Jones indicates the…
The price continues to move down, but the XAGUSD chart shows signs that the downward momentum is likely to end soon.The medium-term movement vector of XAGUSD indicates the formation of…
The USDJPY chart shows signals for the end of the upward movement phase.There is the development of a triple three wave structure on a higher time-frame. Currently, the wave [xx]…
Although the market maintains an upward momentum prevalence, the Dow Jones chart shows signs of a possible end to this trend.There is the development of a triple three wave structure…
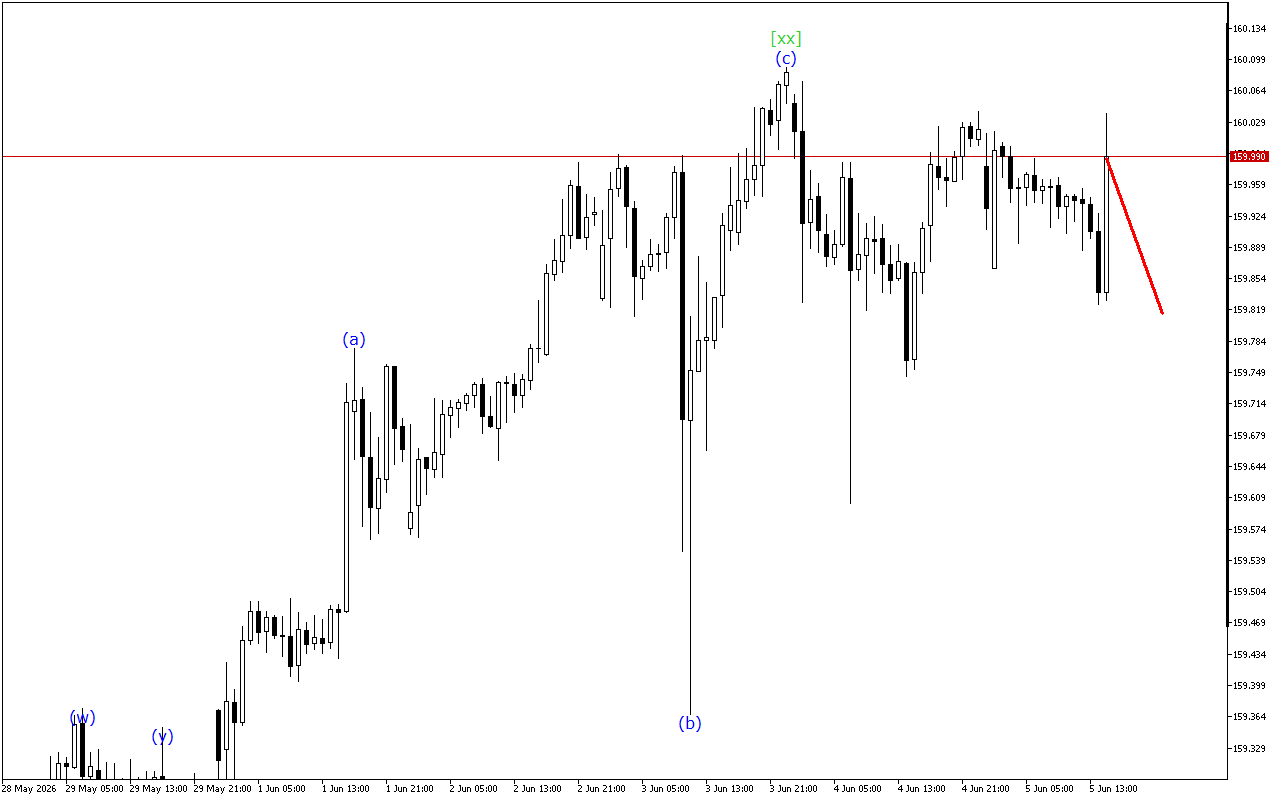
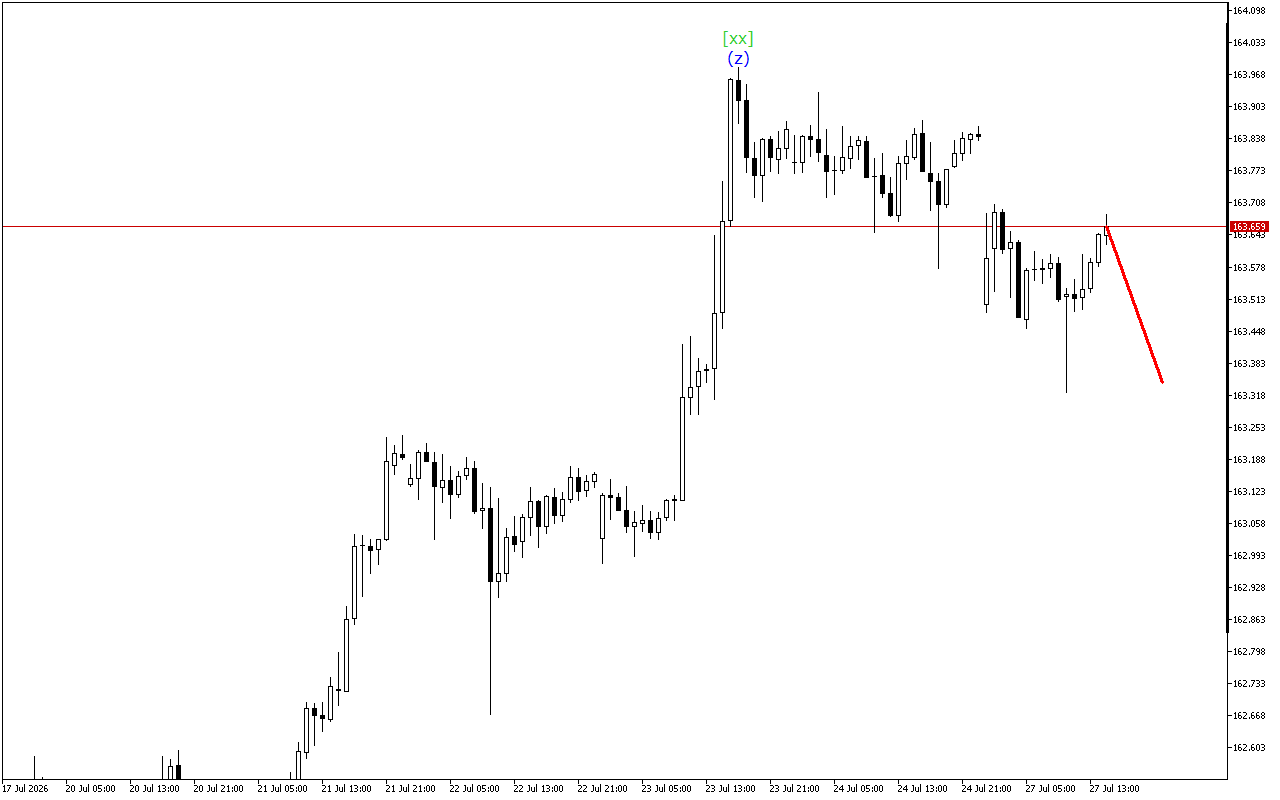
The price continues to move upward, but on the Dow Jones chart you can see signs of an impending completion of the current upward momentum.The current dynamics of the movement…