

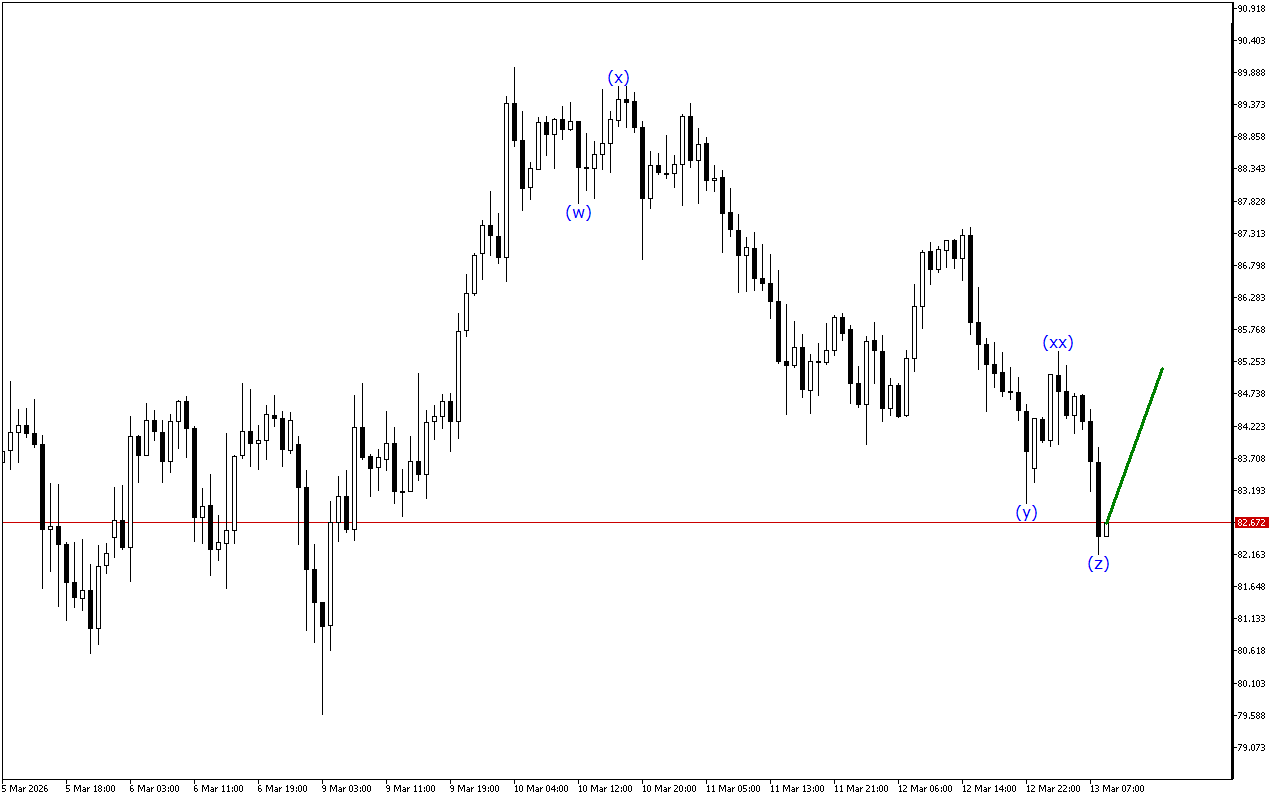
The price continues to move down, but the XAGUSD chart shows signs that the downward momentum is likely to end soon.
The current movement should be considered as part of a corrective zigzag. Within this structure, wave [b] has been formed. It should be followed by an ascending wave [c].
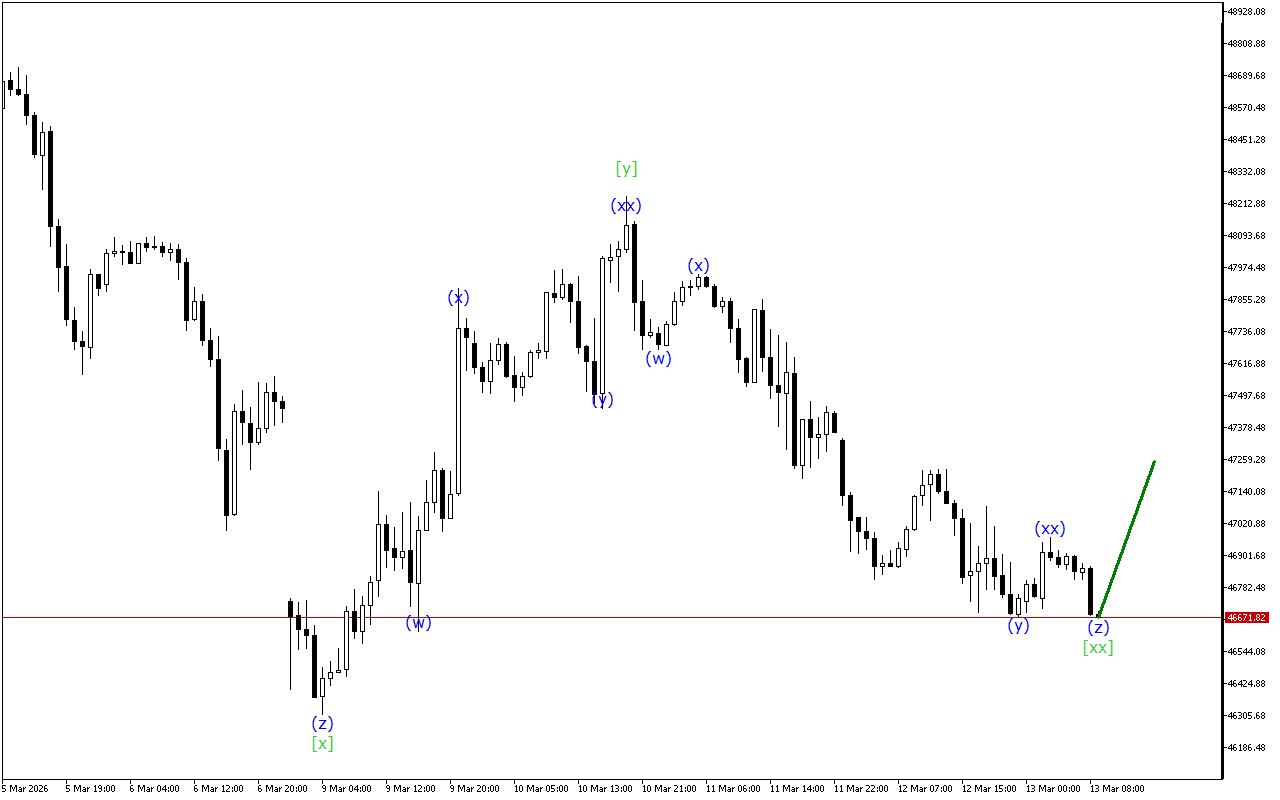
At a lower degree of the wave structure, the development of a triple three, where the formation of wave (z) has completed, is seen.
Despite the current downward movement on the XAGUSD chart, the situation may change soon. The corrective wave is close to completion, which may indicate the possibility of a price reversal.
In the current situation, it is worth paying more attention to long positions.
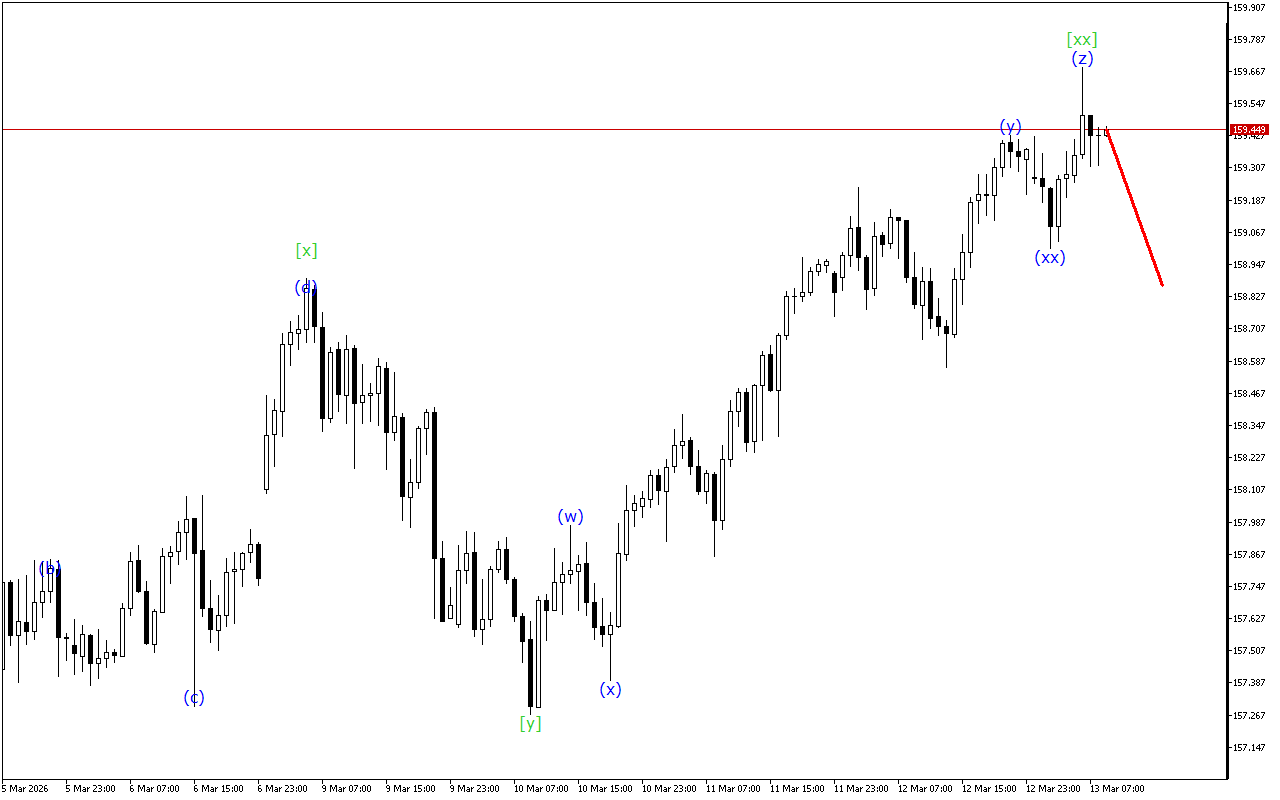
Alternative scenario
Short positions will be relevant after the breakout of the current wave start level


