


Despite the steady decline in price, the XAGUSD chart is giving signals about a possible completion of the current bearish momentum.
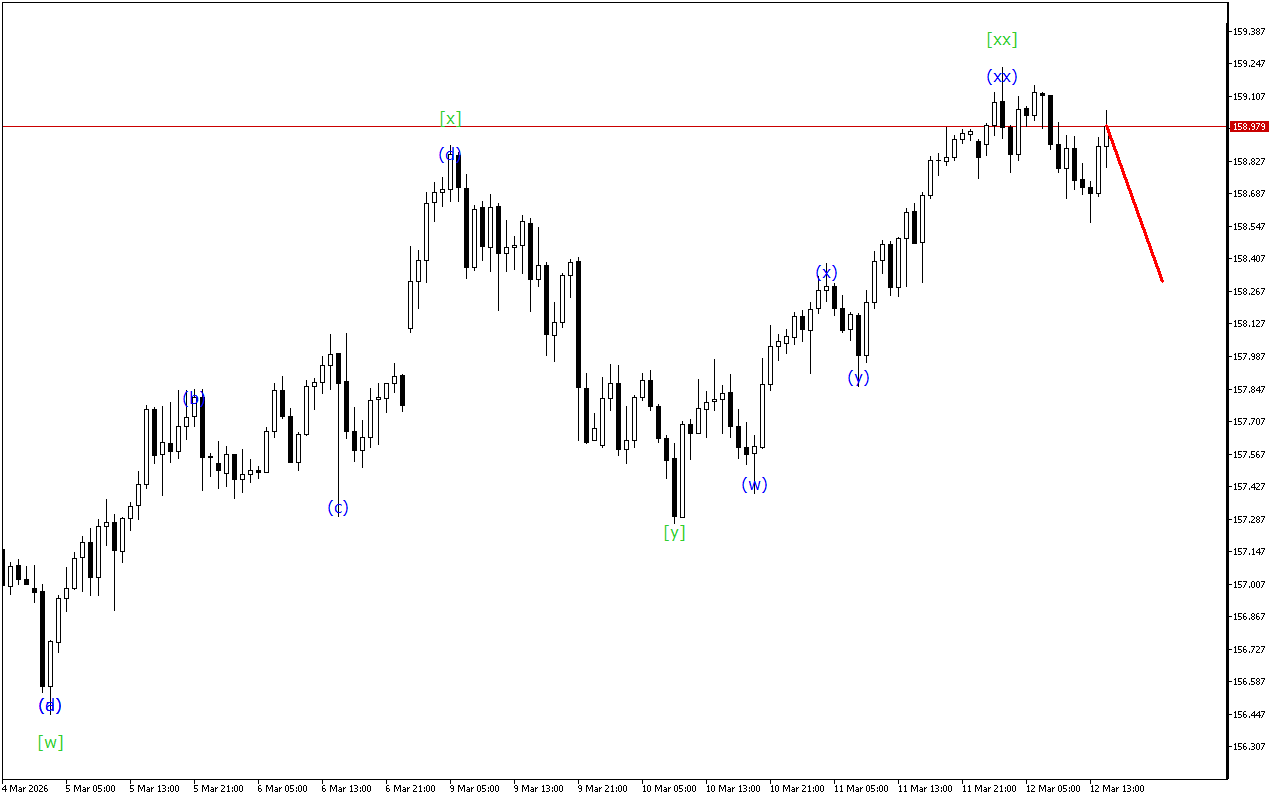
It is now possible to identify an unfinished zigzag at a higher interval. Within this correctional wave model, a downward wave [b] has been formed. When its formation is completed, the development of an upward impulse within wave [c] should be seen.
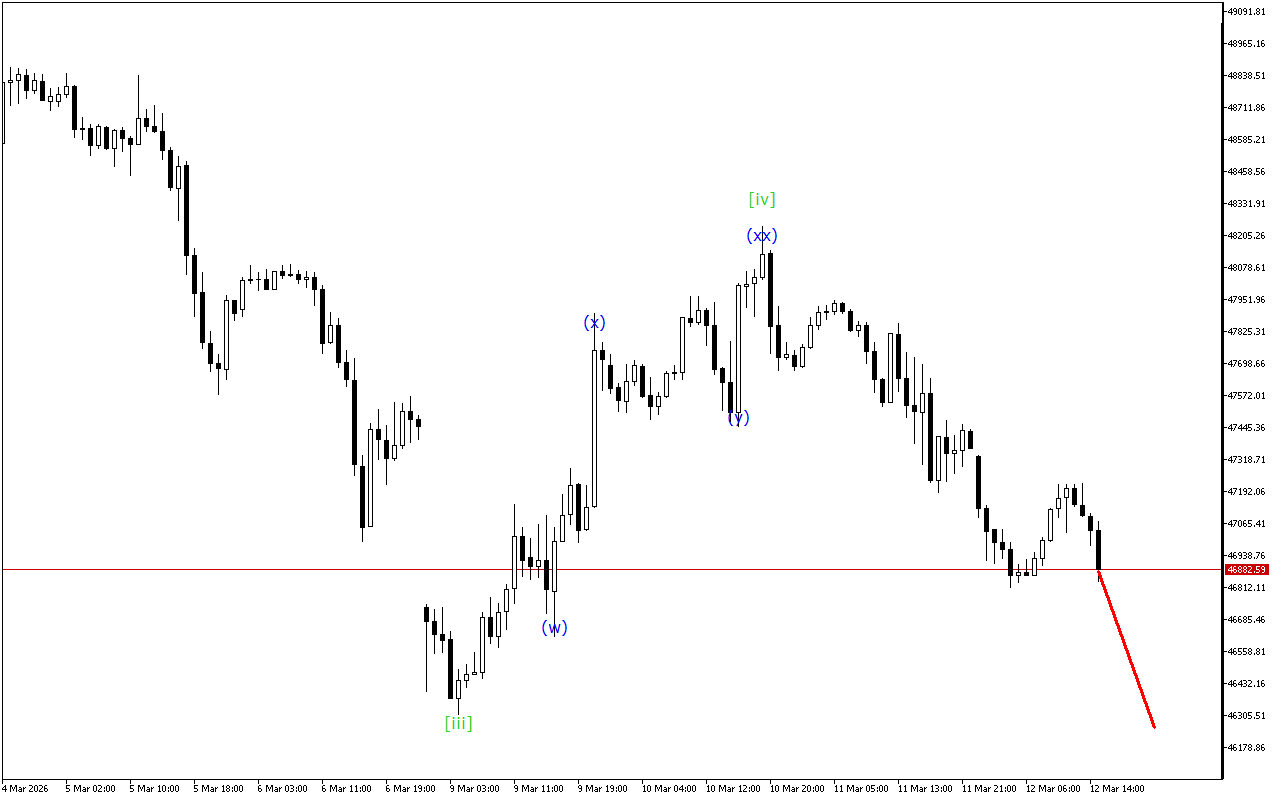
Waves of a lower time-frame form a triple three. The price is currently in the wave (z). When this wave is completed, a more directional price movement is expected.
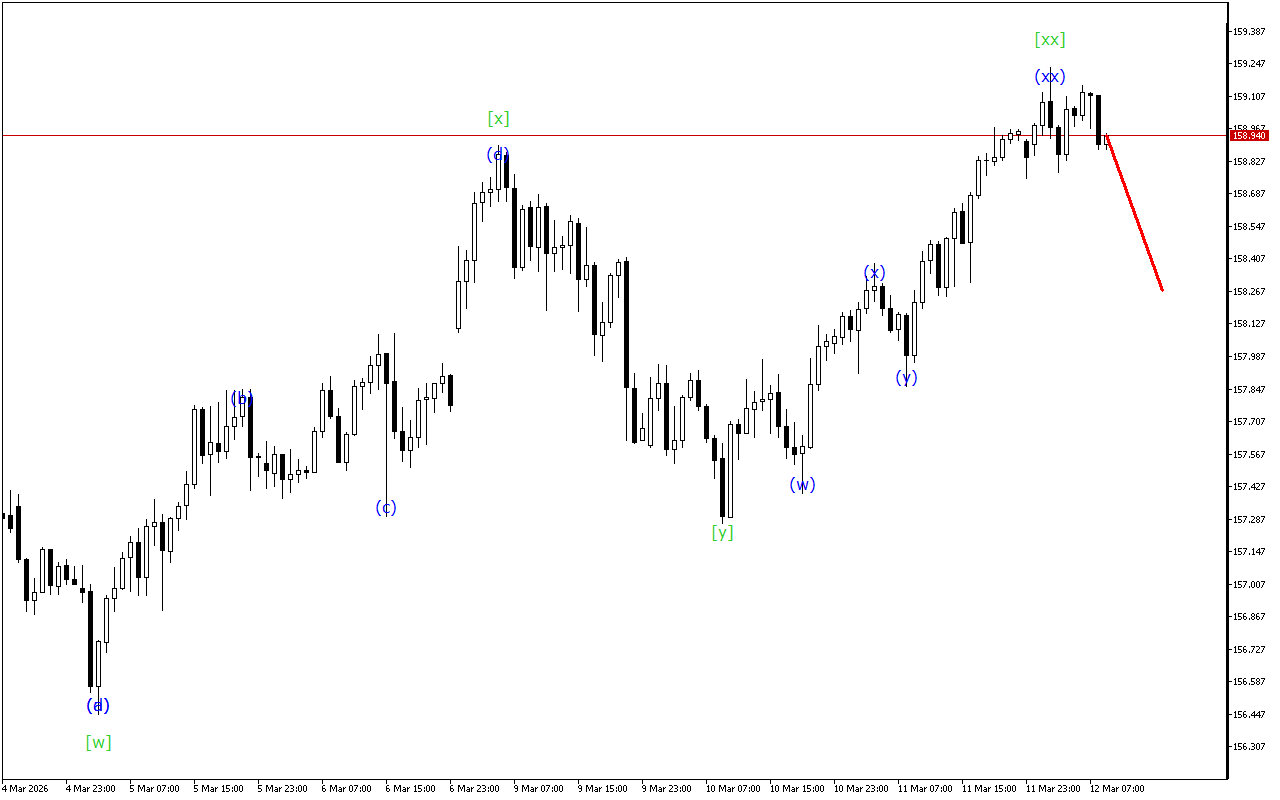
To summarize, at the moment the XAGUSD chart is maintaining a downward movement vector. However, the corrective wave is in the final stage of formation.
In this situation, long positions are prioritized.
Alternative scenario
Short positions will be relevant after the breakout of the current wave start level

