

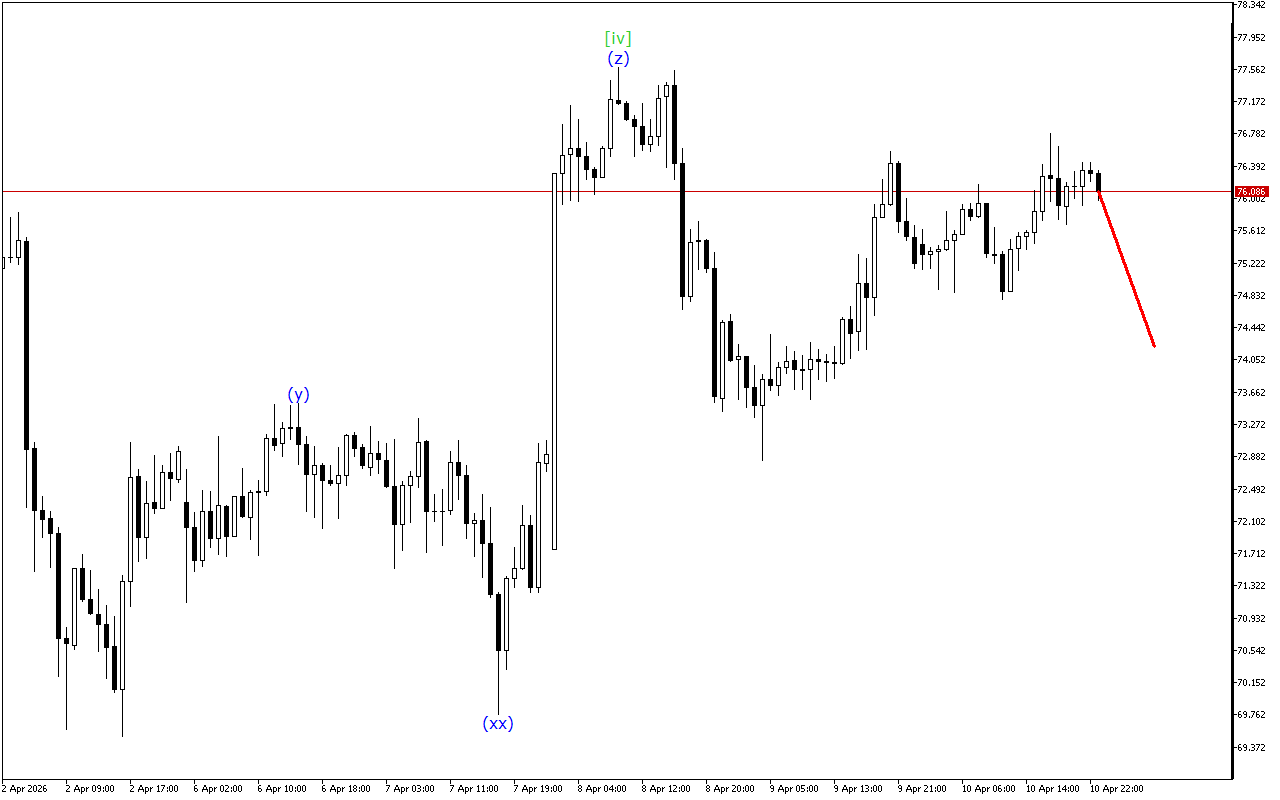
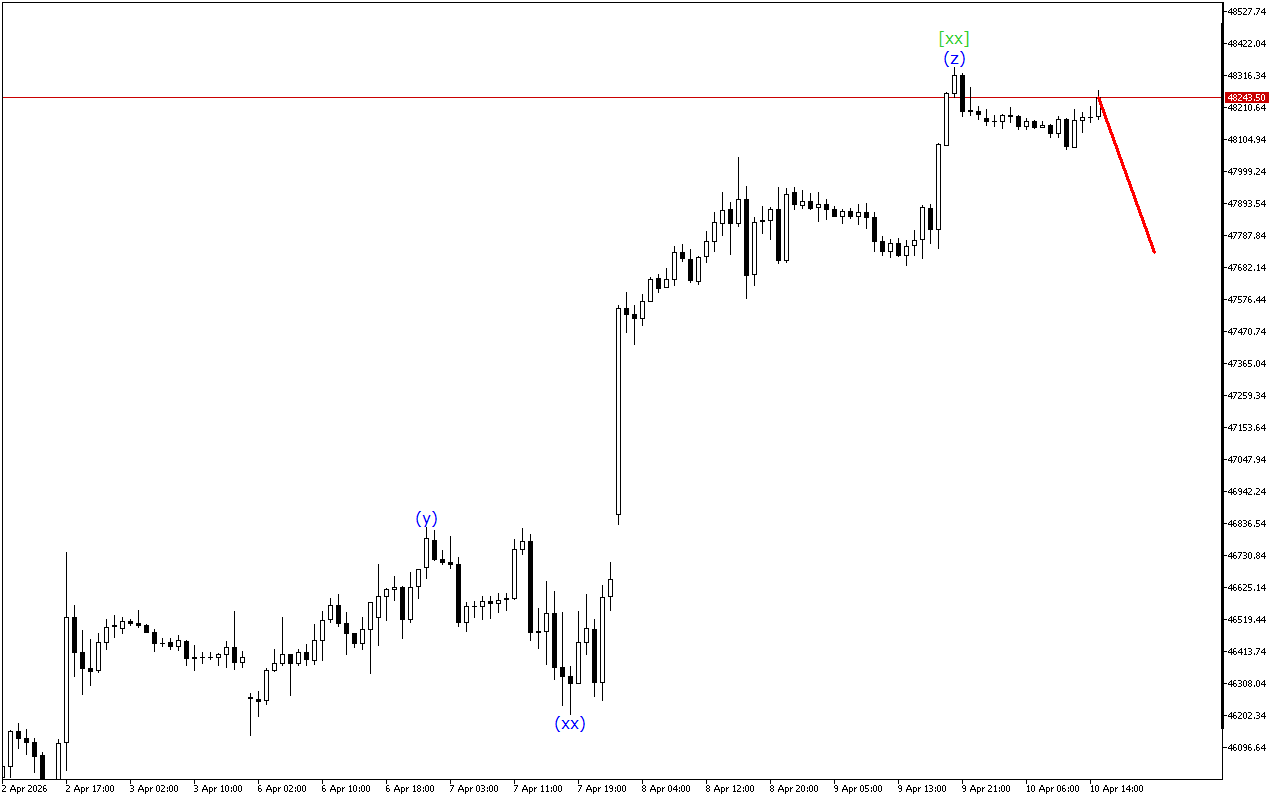
Although the market continues to move higher, the XAGUSD chart is showing some signs of fatigue in the upward momentum.
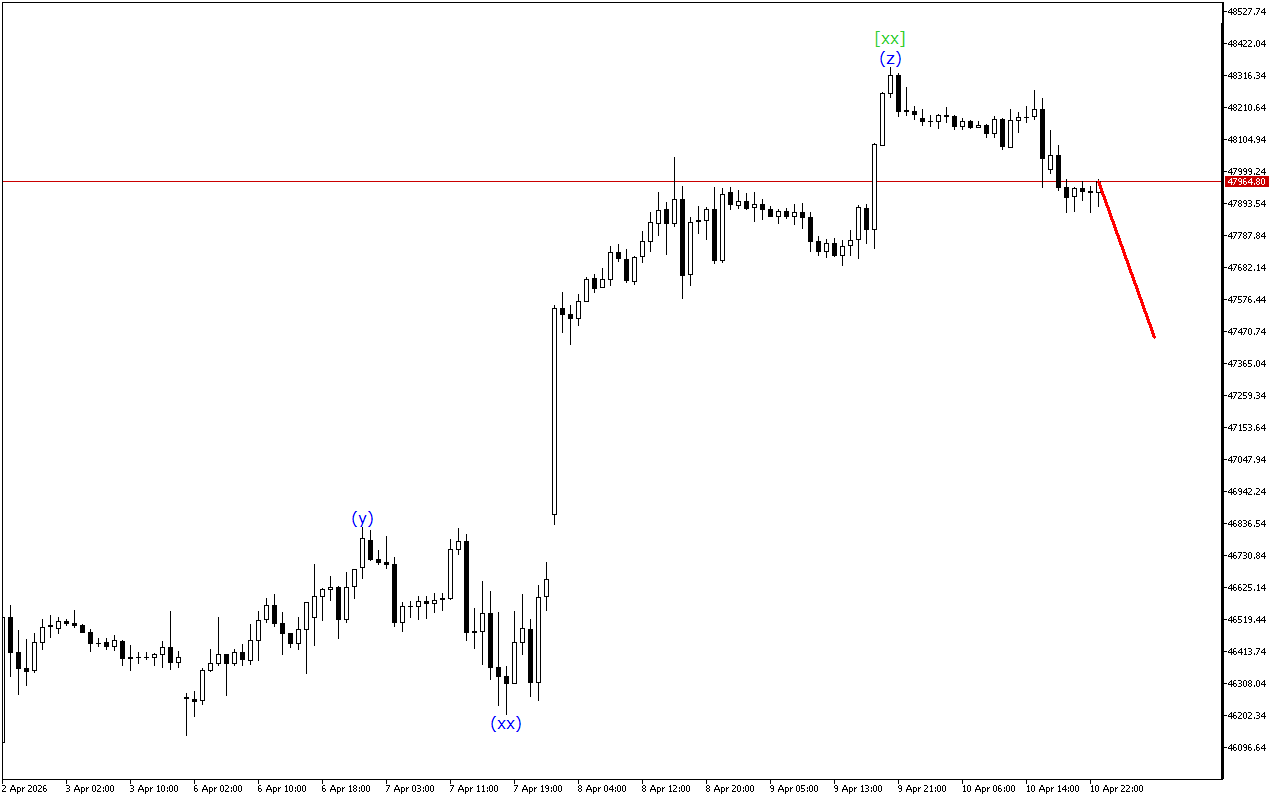
There is the development of a triple three wave structure on a higher time-frame. Currently, the wave [xx] has been formed. After this the price should resume its downward movement.
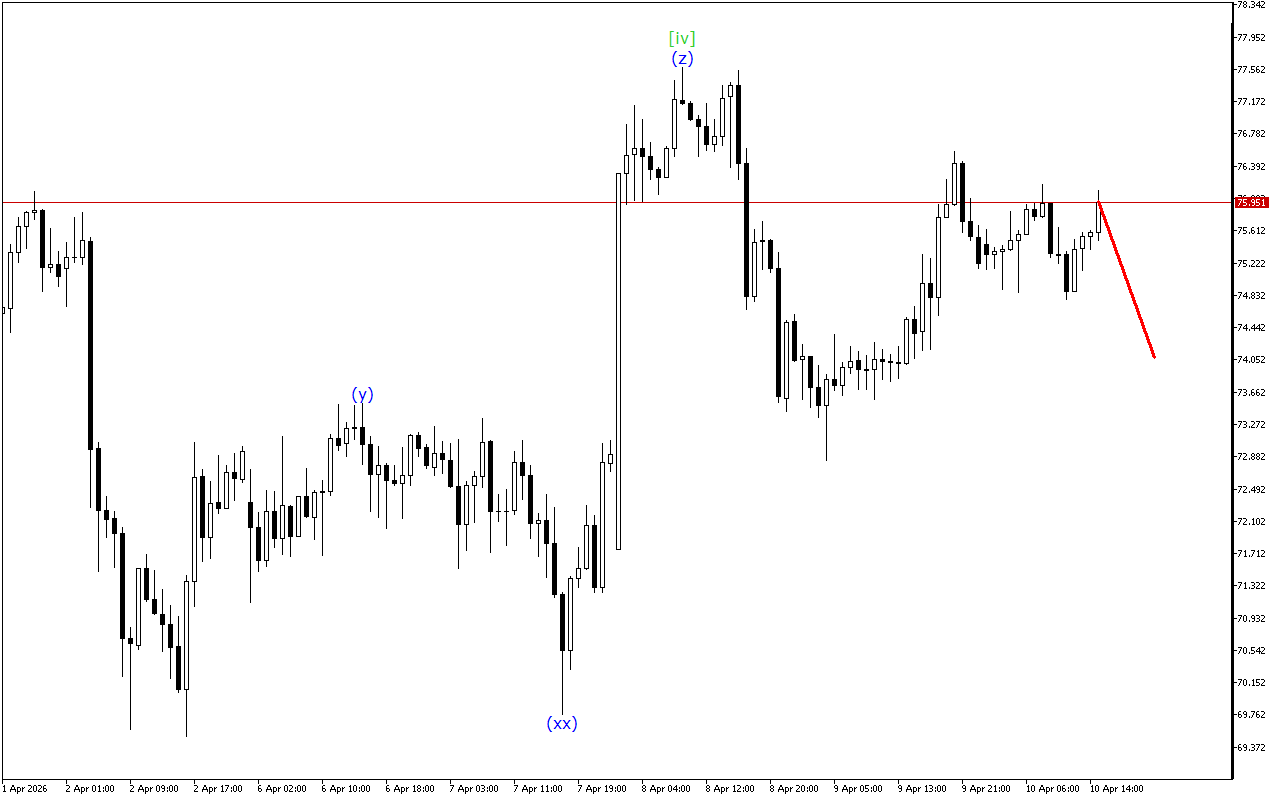
According to a lower-degree wave structure, XAGUSD is now moving within the ABC zigzag. In this case, the price is likely completing the formation of the wave (c).
Despite the positive dynamics of the market movement, the possibility of resuming the downward movement after the completion of the current wave shouldn’t be excluded.
In this situation, it should be emphasized that short positions remain preferable.
Alternative scenario
Long positions should be looked for after the breakout of the top of the current wave.
XAGUSD H1: Wave Analysis for the European Session on 20.2.2026
Related Posts
XAGUSD H1: Wave Analysis for the Asian Session on 13.4.2026
Although the market continues to move higher, the XAGUSD chart is showing some signs of fatigue in the upward momentum.The analysis of the wave structure indicates the development of an…
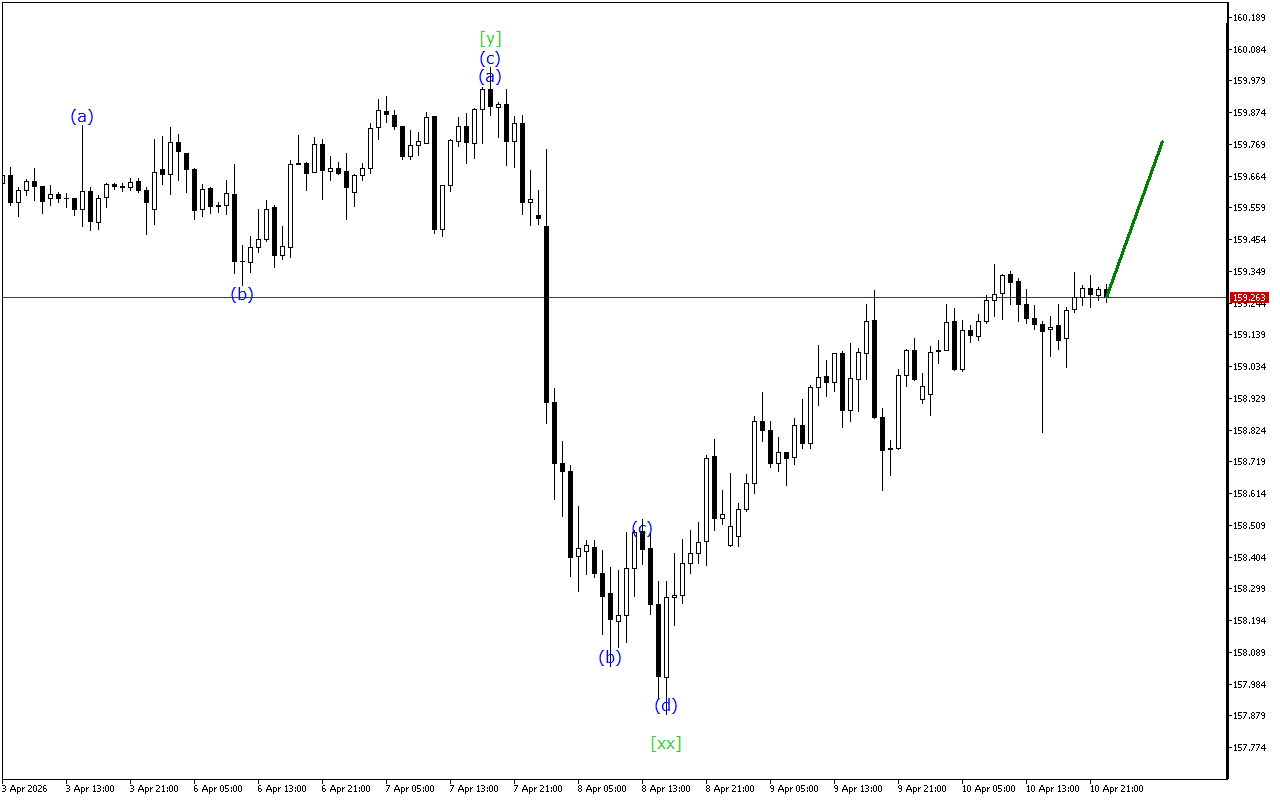
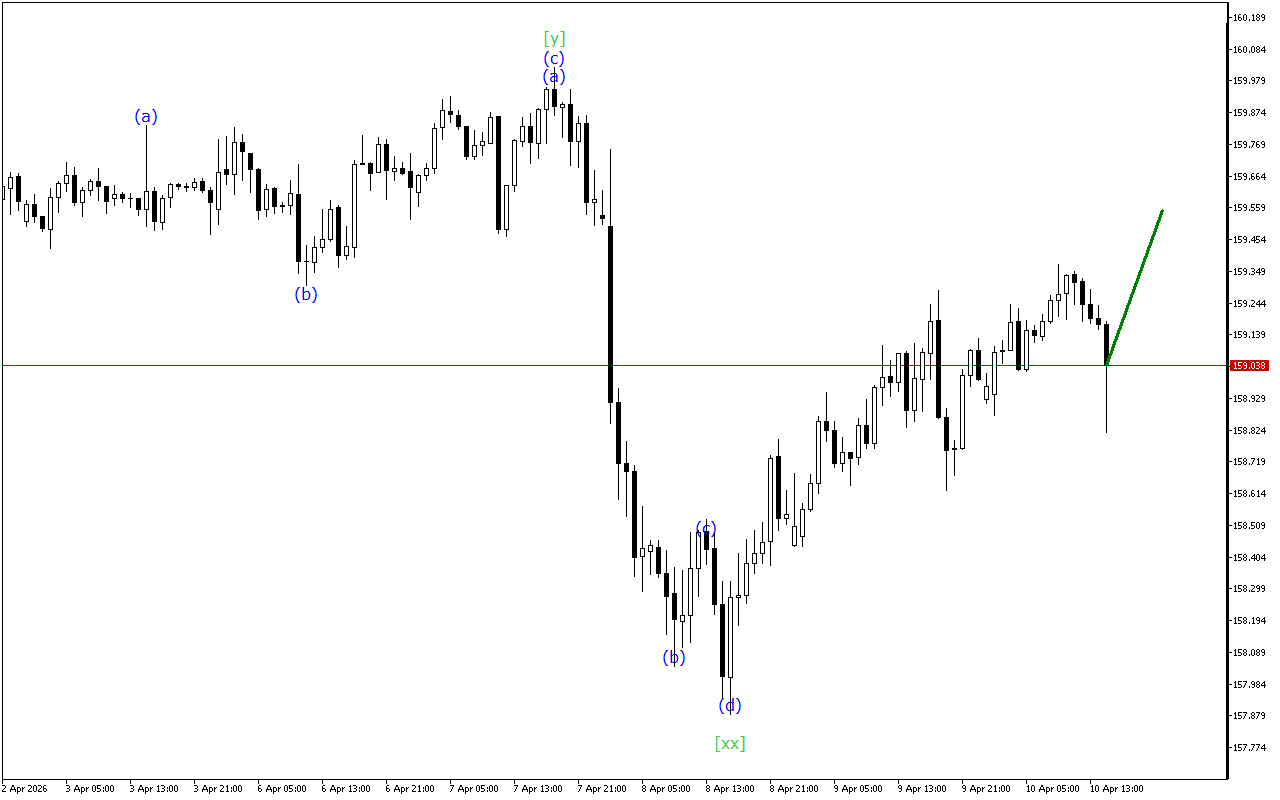
USDJPY H1: Wave Analysis for the Asian Session on 13.4.2026
Despite the decline, there are signals on the USDJPY chart indicating a possible upcoming change in direction.USDJPY continues to move within the Triple Three wave structure. Now, apparently, the formation…