

The market is still heading down, but the chart shows signs that the current trend will end soon.
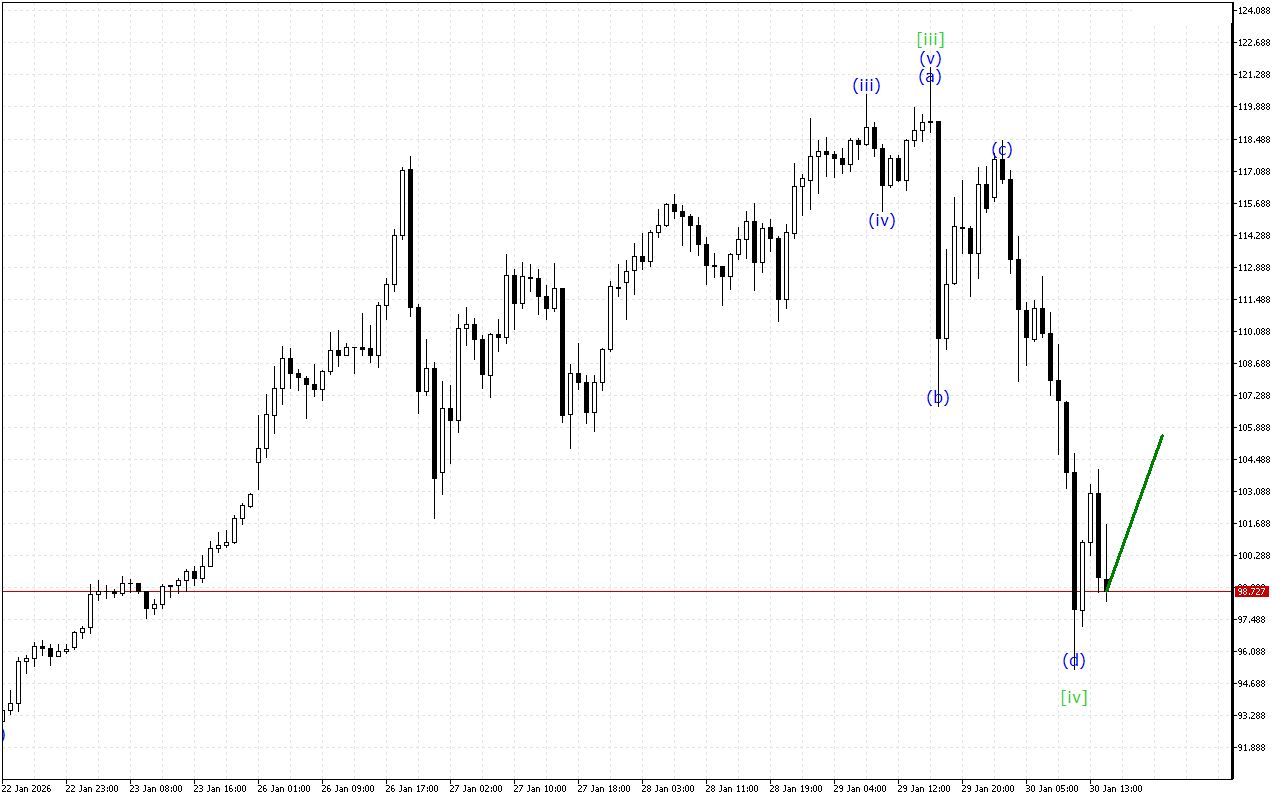
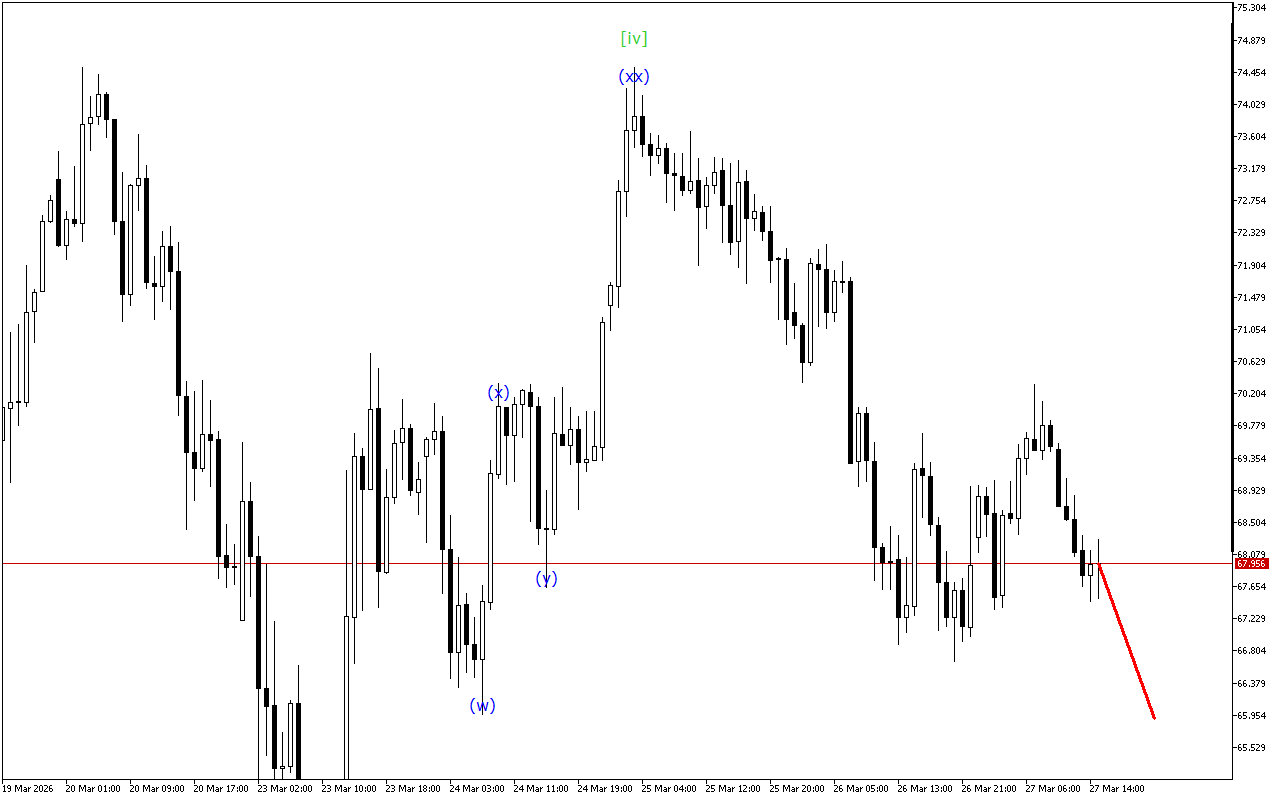
At a higher time interval, an ascending wedge continues to form. A downward corrective wave [iv] has been formed in this movement by this moment. Once this wave is completed, the formation of an upward wave [v] should be seen.
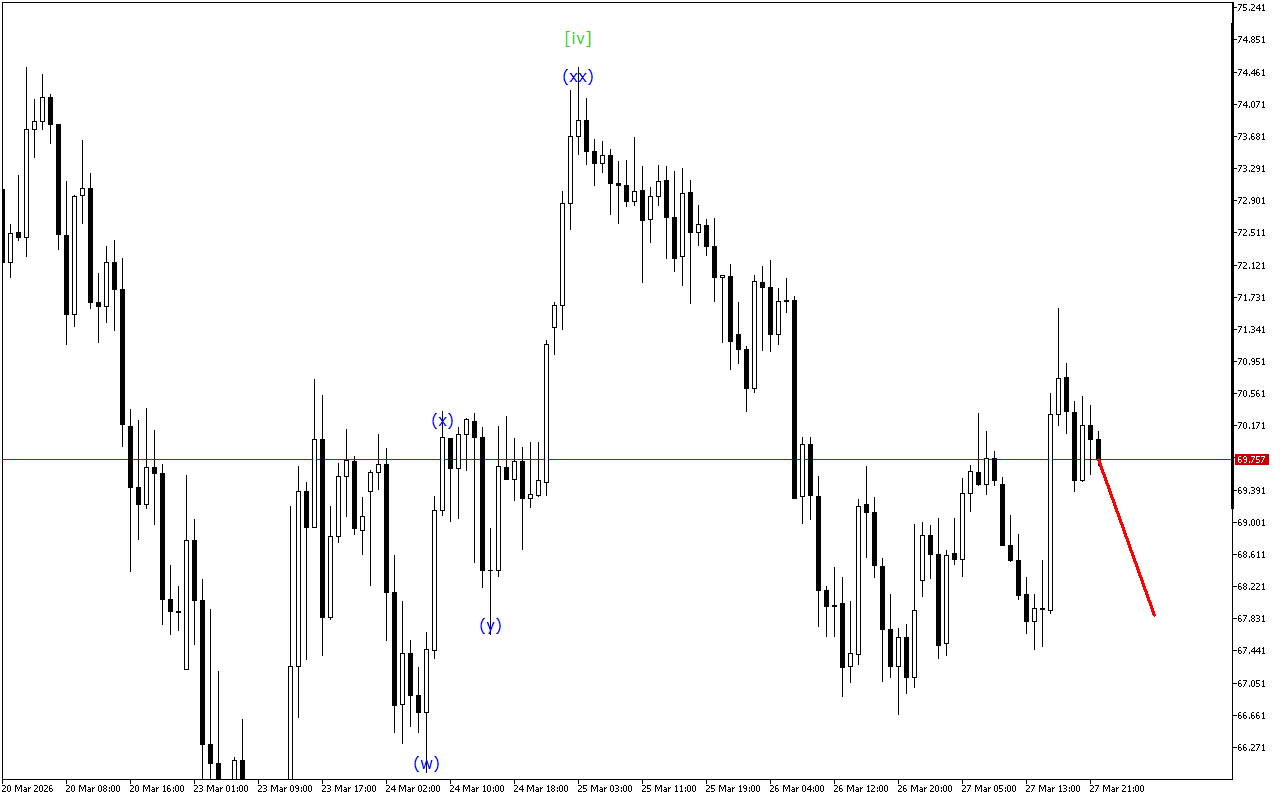
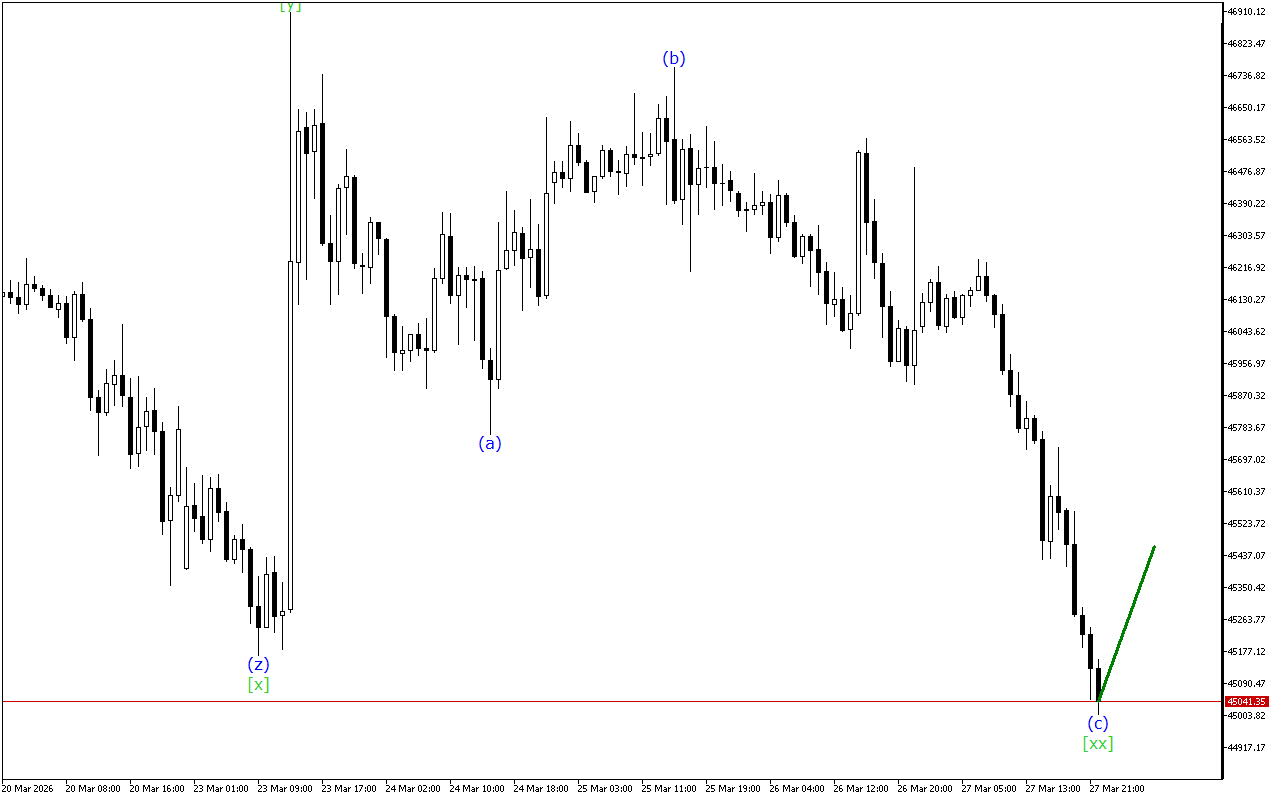
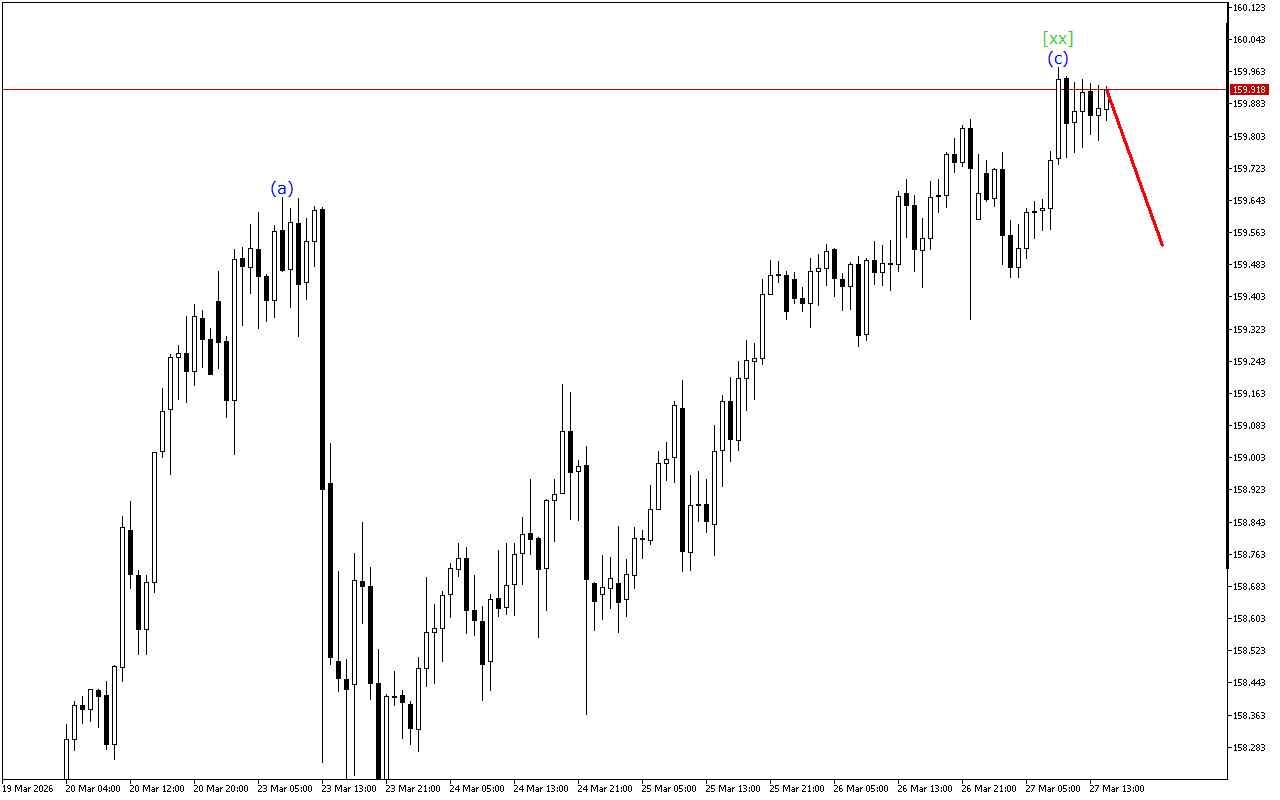
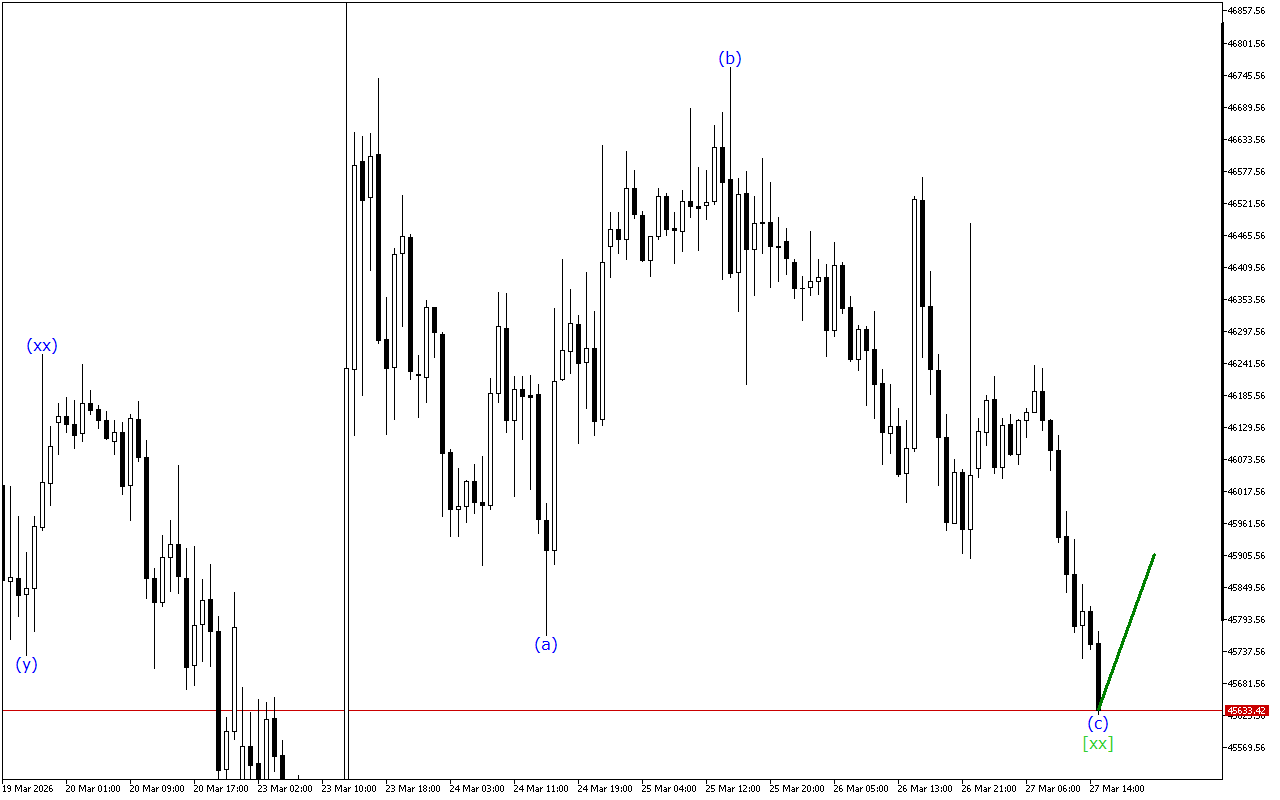
According to a smaller time-frame, the market moves within the ABC zigzag. Currently, the price is completing the formation of the wave (c) apparently and the price movement may move into a new wave formation.
To summarize, at the moment the XAGUSD chart is maintaining a downward movement vector. However, the corrective wave is in the final stage of formation.
In this situation, long positions are prioritized.
Alternative scenario
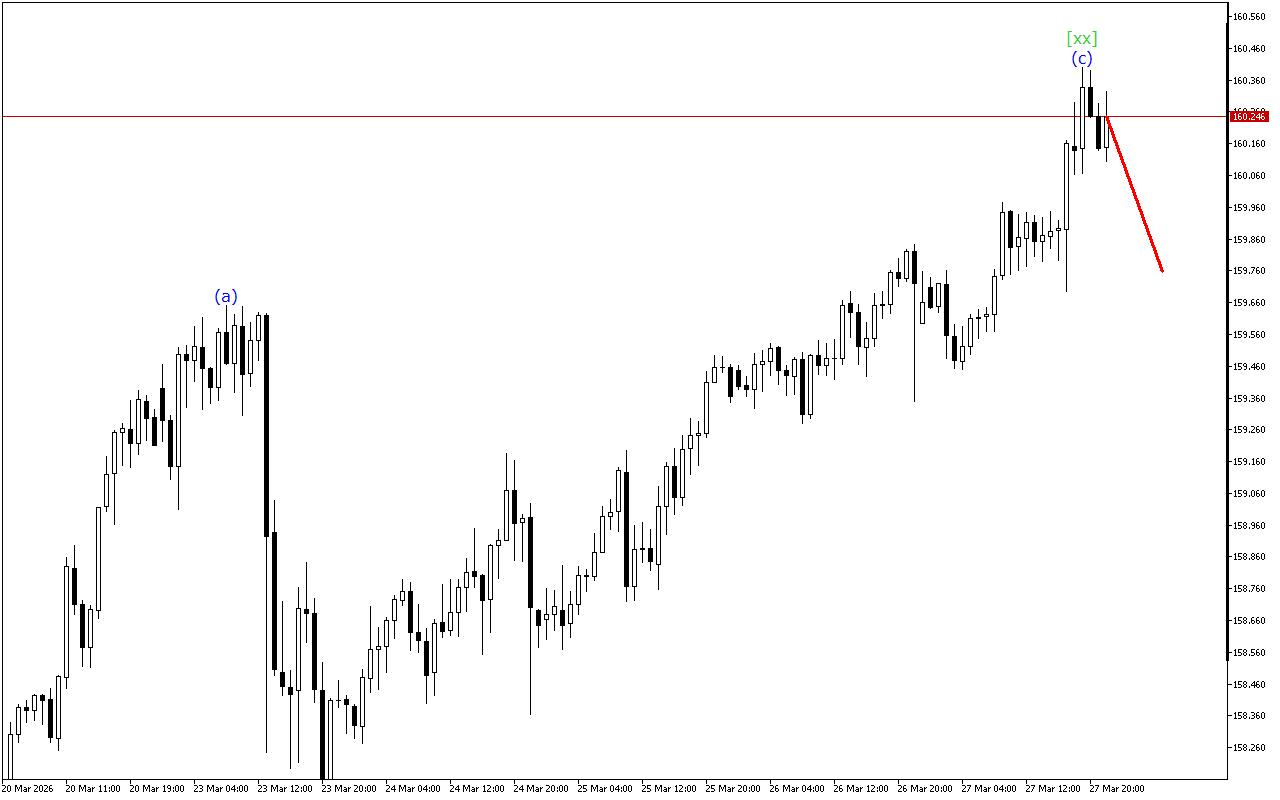
Short positions will be relevant after the breakout of the current wave start level