

The price continues to move down, but the XAGUSD chart shows signs that the downward momentum is likely to end soon.
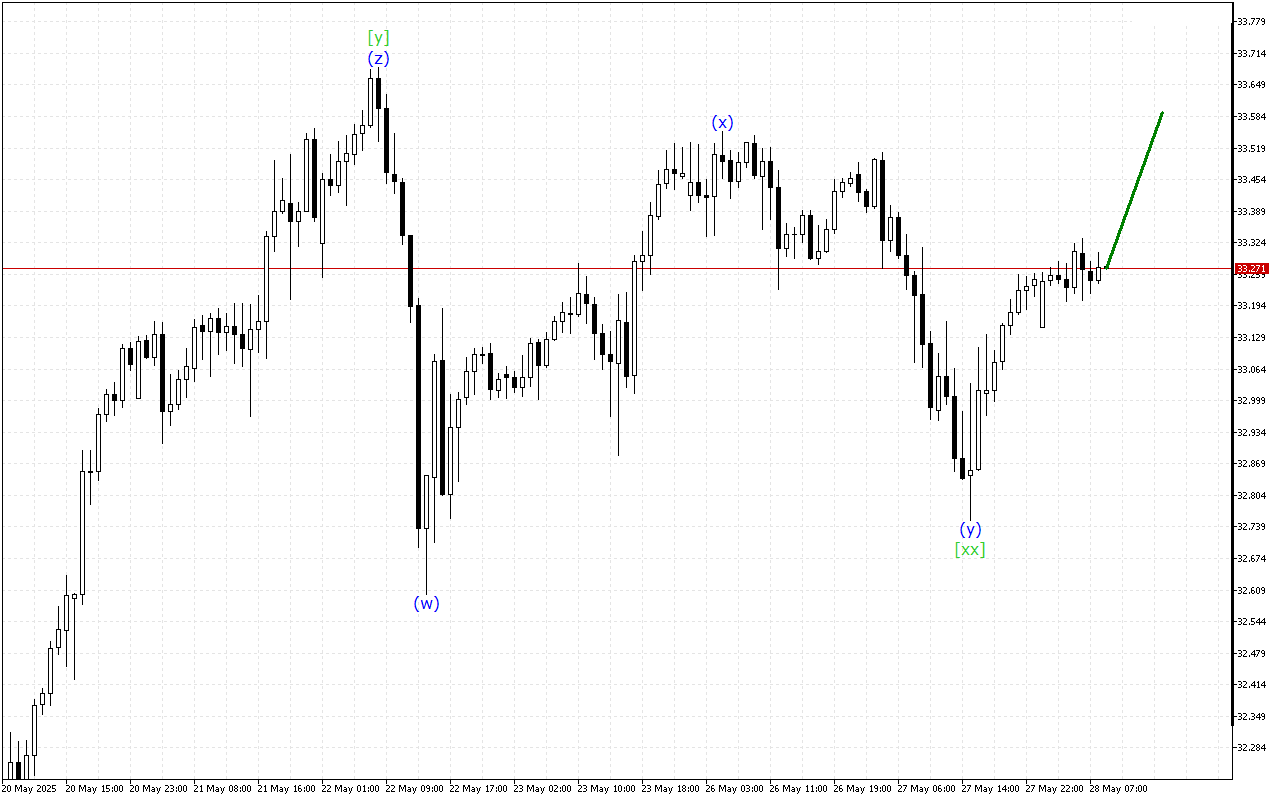
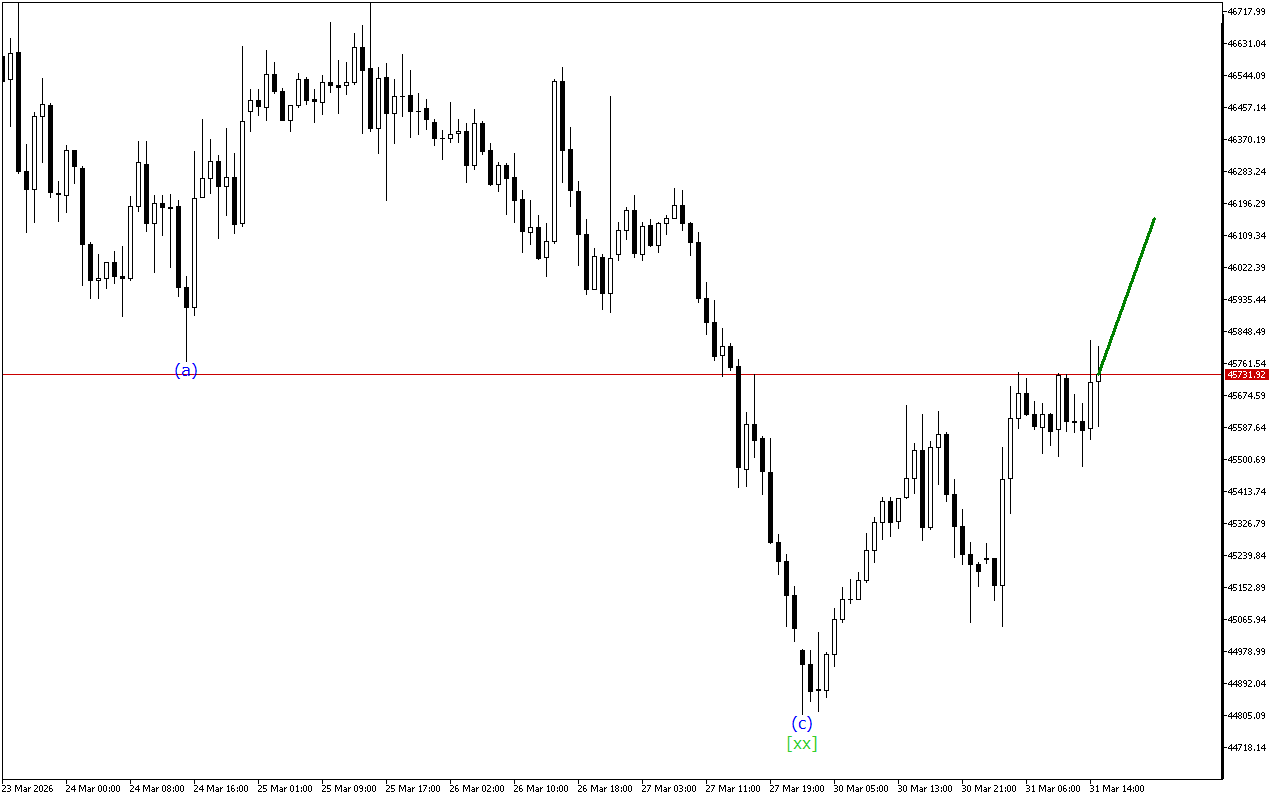
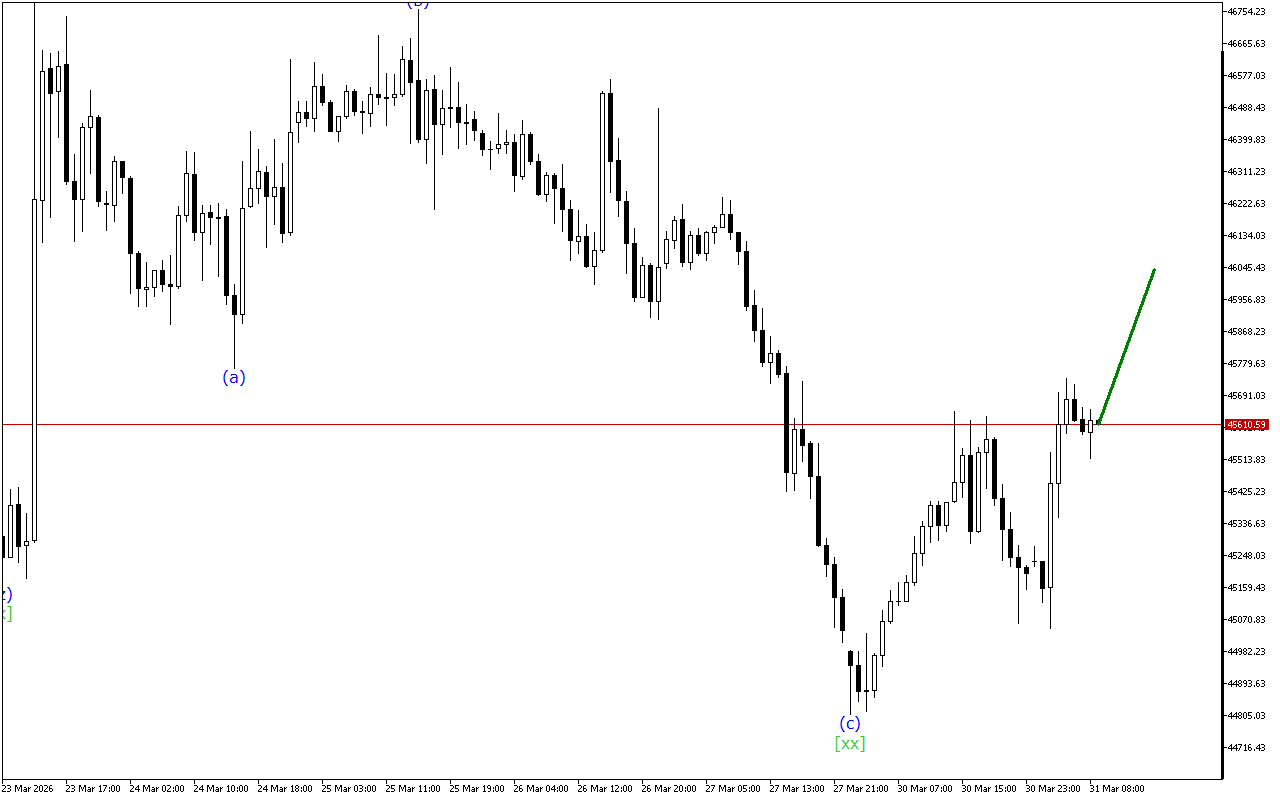
The medium-term movement vector of XAGUSD indicates the formation of a Triple Three wave structure. Now the formation of the wave [xx] is completed and the beginning of an upward movement within the wave [z] is expected.
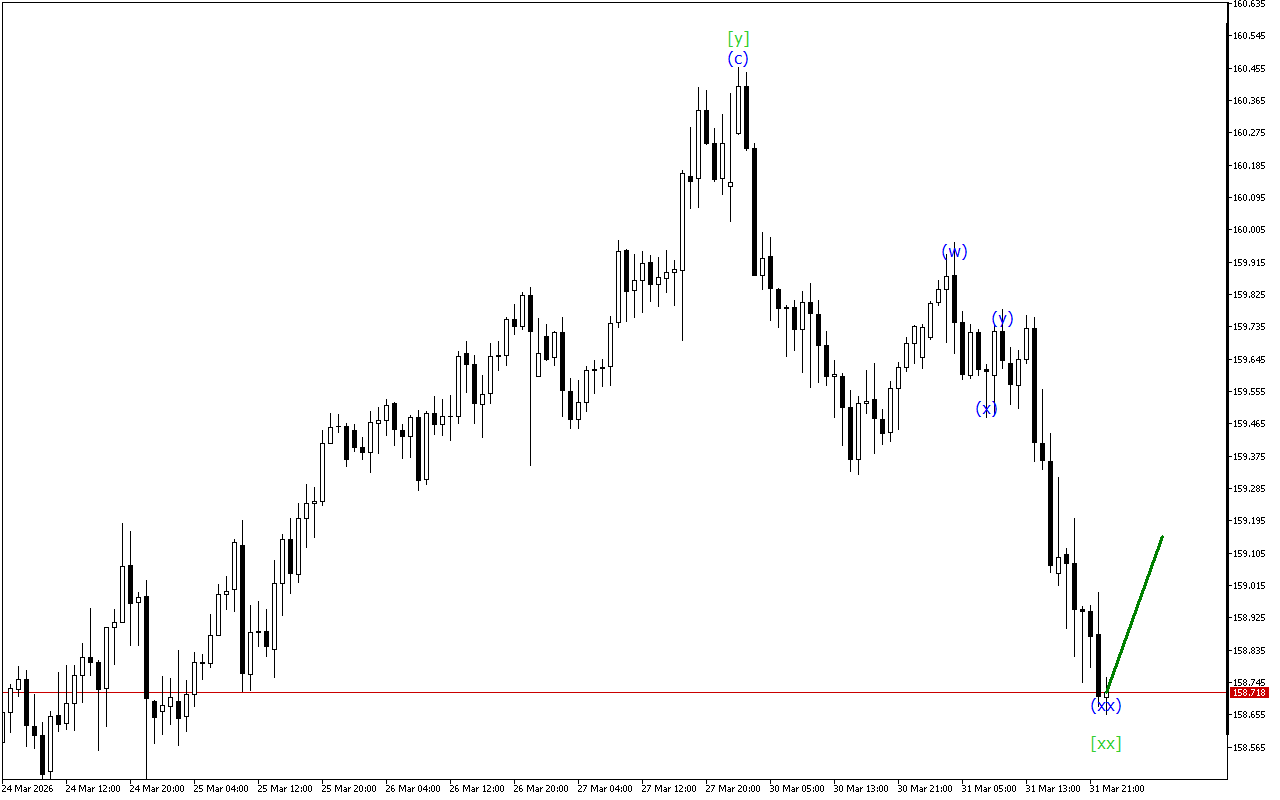
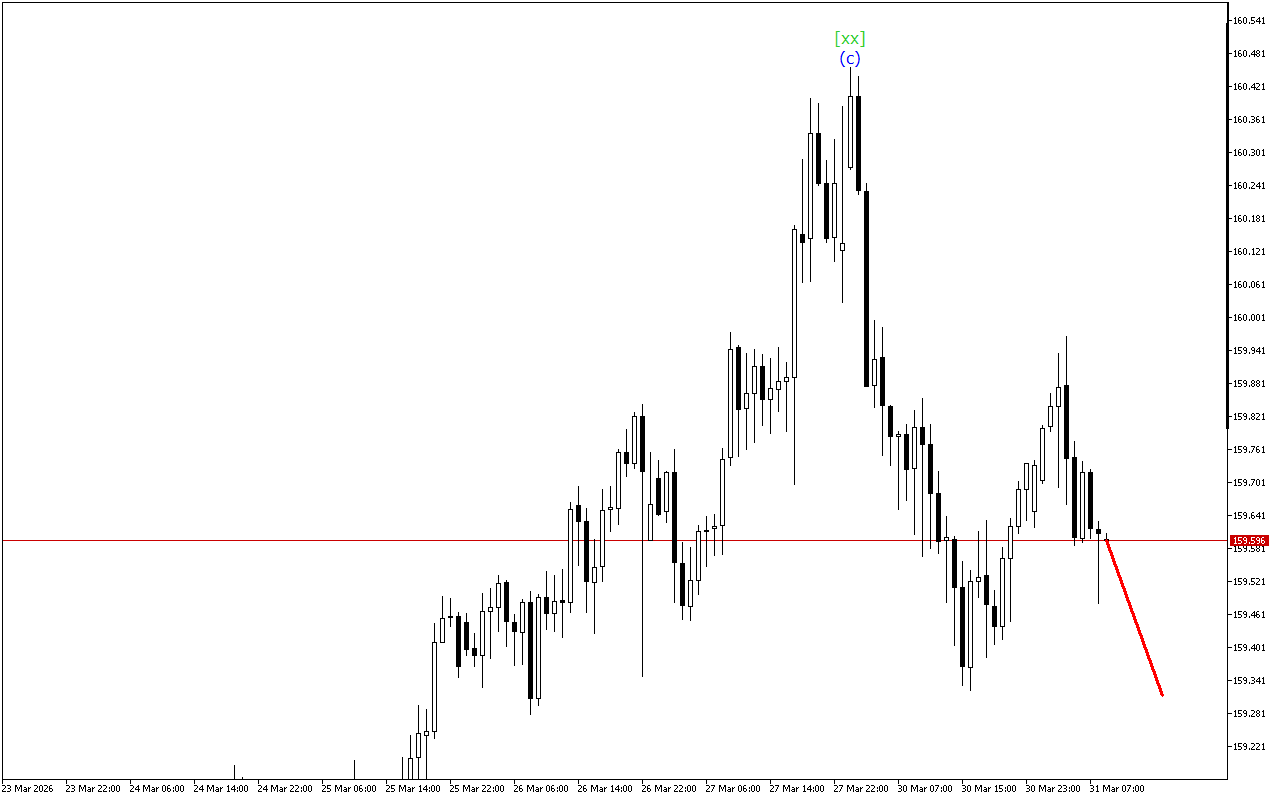
The Double Three wave structure is being formed on the highest time-frame on XAGUSD. After the completion of the corrective structure, the price may resume a more directional movement.
To summarize, at the moment the XAGUSD chart is maintaining a downward movement vector. However, the corrective wave is in the final stage of formation.
In this situation, long positions are prioritized.