

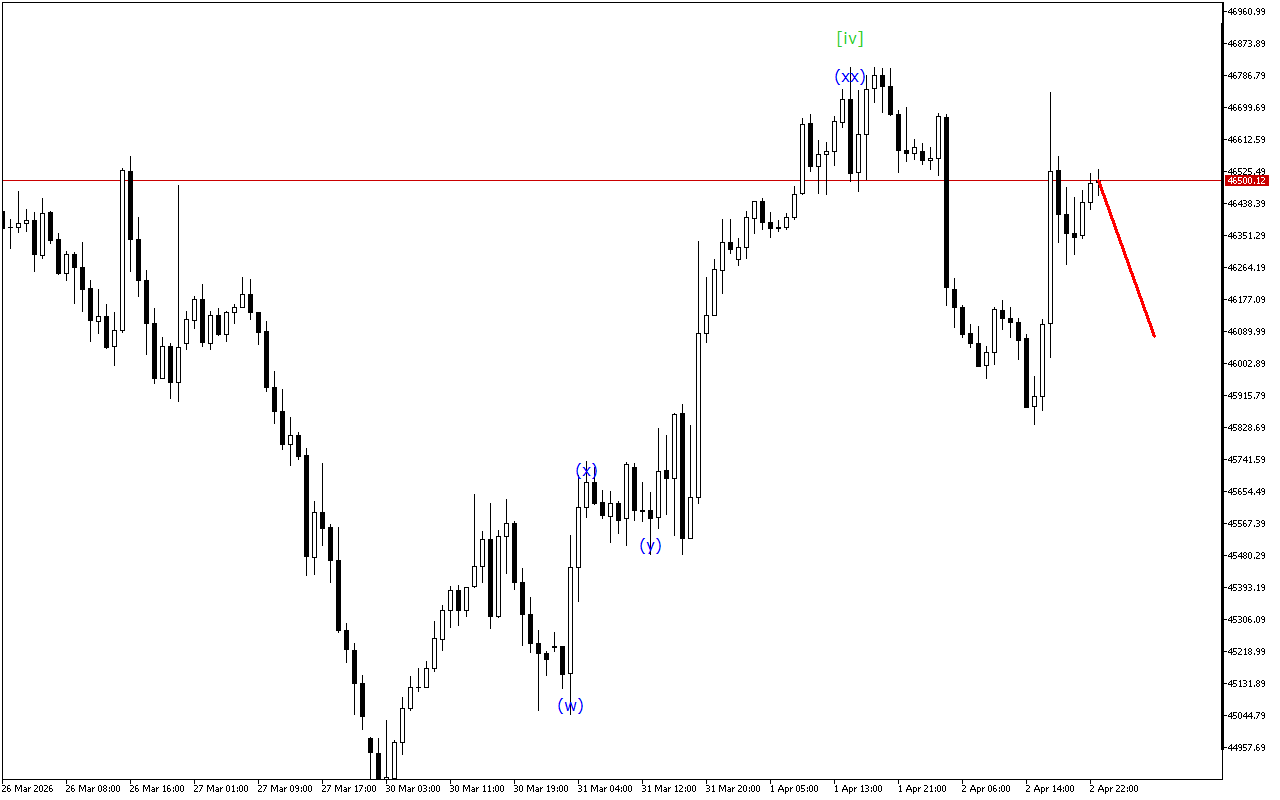
The XAGUSD chart shows signals for the end of the upward movement phase.
There is the development of a triple three wave structure on a higher time-frame. Currently, the wave [xx] has been formed. After this the price should resume its downward movement.
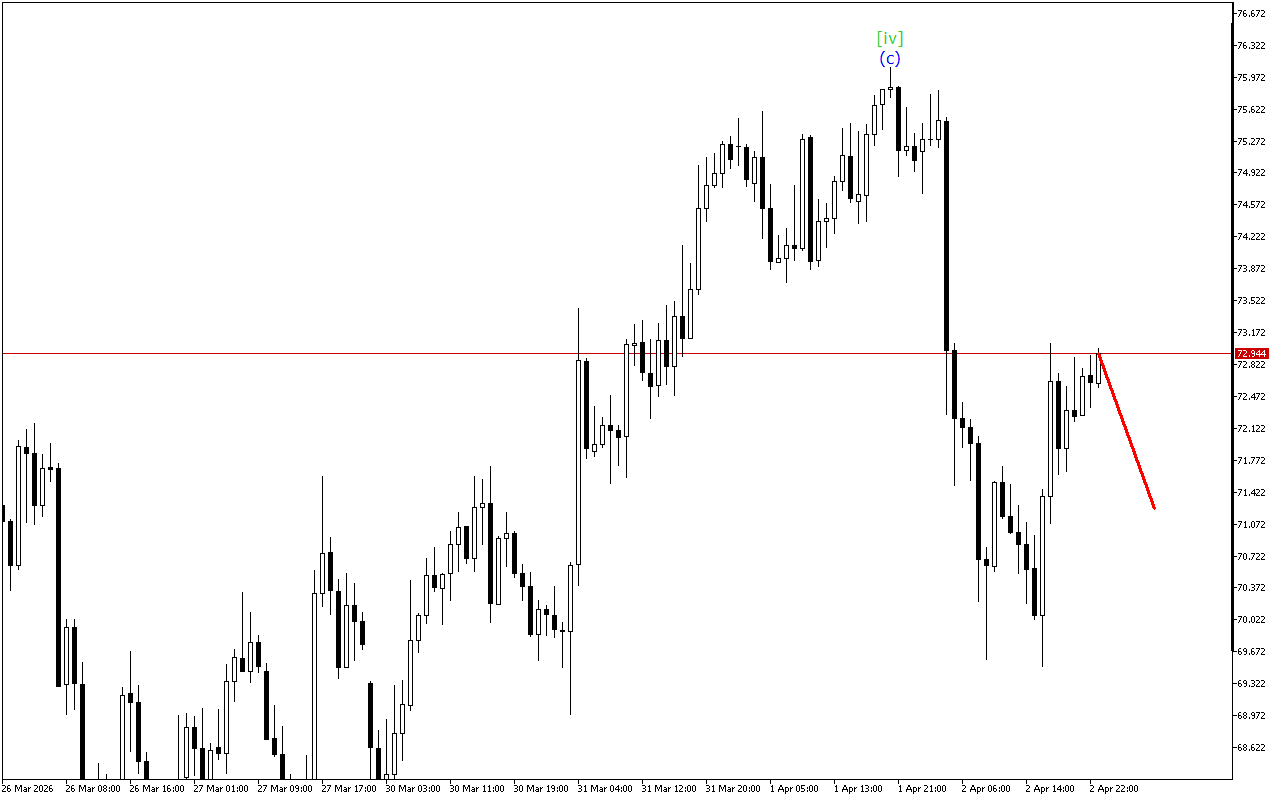
According to a lower-degree wave structure, XAGUSD is now moving within the ABC zigzag. In this case, the price is likely completing the formation of the wave (c).
Despite the positive dynamics of the market movement, the possibility of resuming the downward movement after the completion of the current wave shouldn’t be excluded.
In this situation, it should be emphasized that short positions remain preferable.
XAGUSD H1: Wave Analysis for the European Session on 21.7.2025
Related Posts
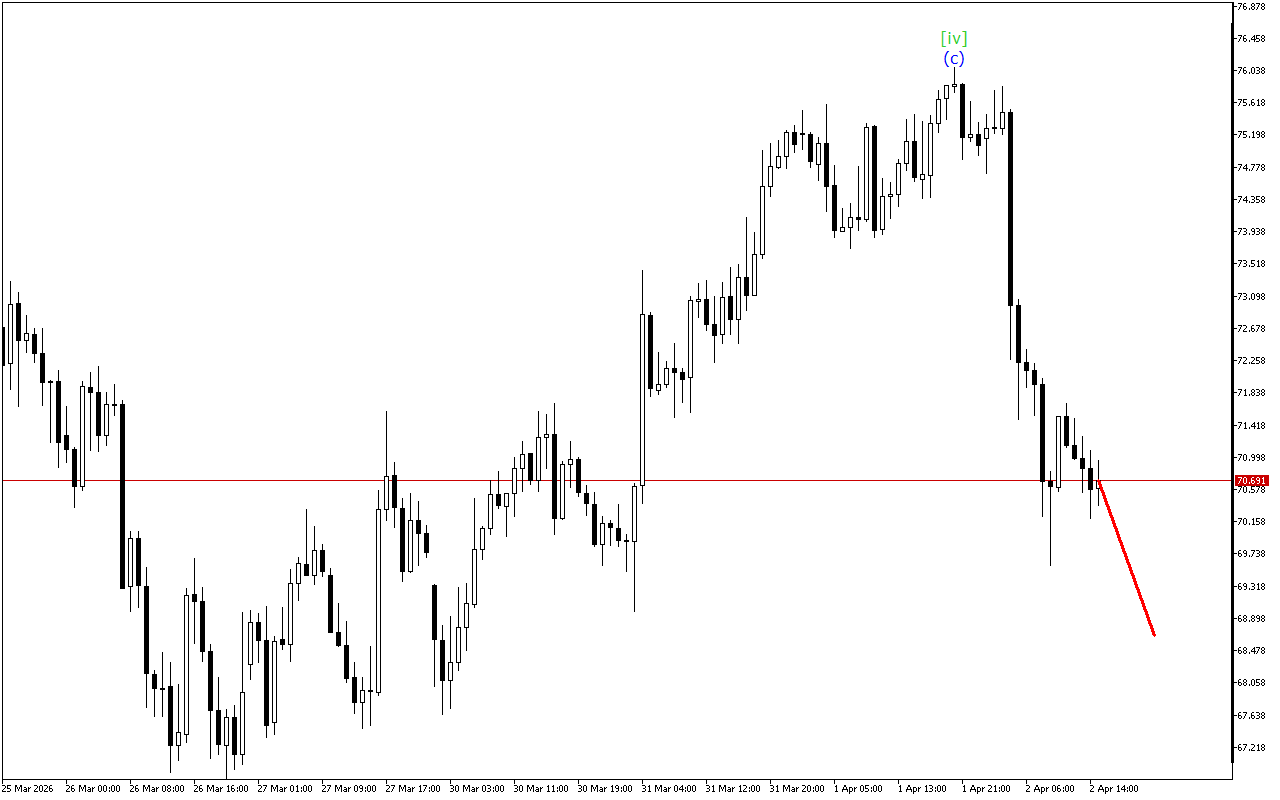
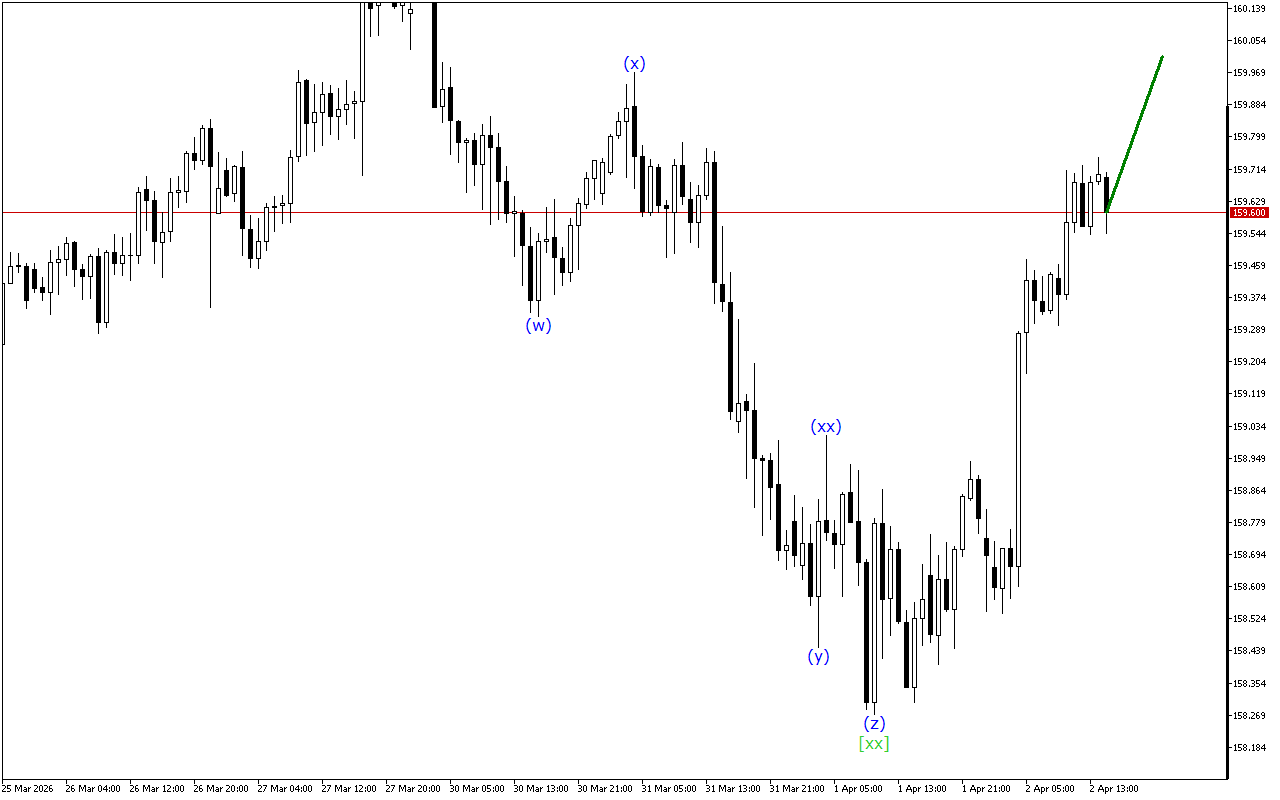
XAGUSD H1: Wave Analysis for the Asian Session on 3.4.2026
Although the market maintains an upward momentum prevalence, the XAGUSD chart shows signs of a possible end to this trend.The analysis of the wave structure indicates the development of an…
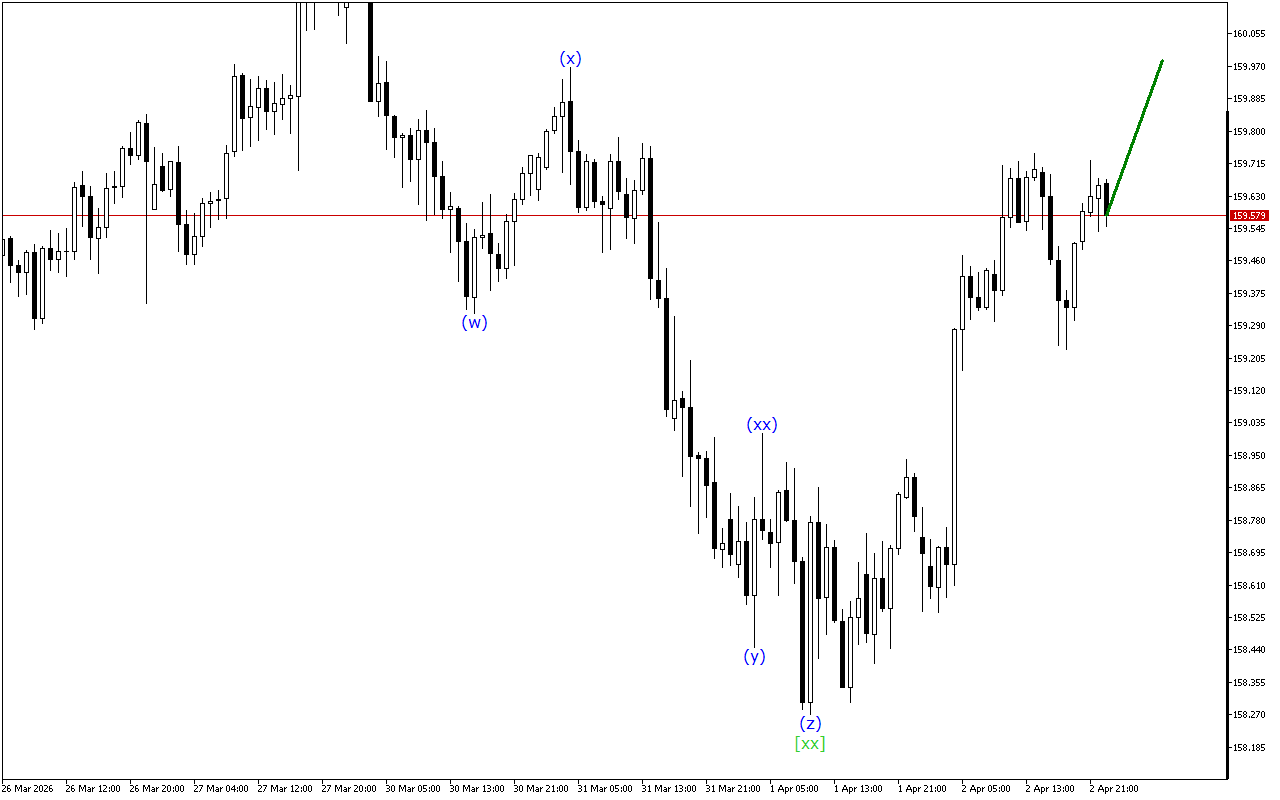
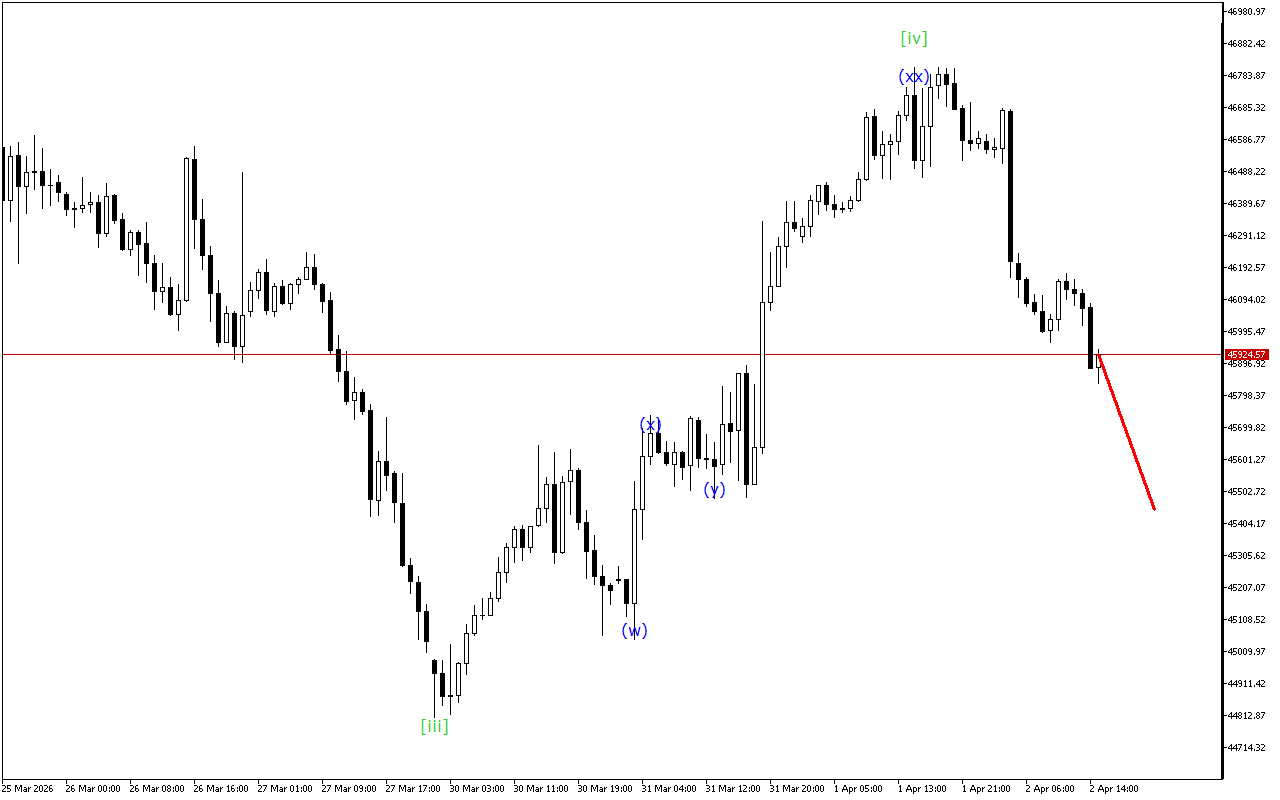
USDJPY H1: Wave Analysis for the Asian Session on 3.4.2026
The market is still heading down, but the chart shows signs that the current trend will end soon.USDJPY continues to move within the Triple Three wave structure. Now, apparently, the…