

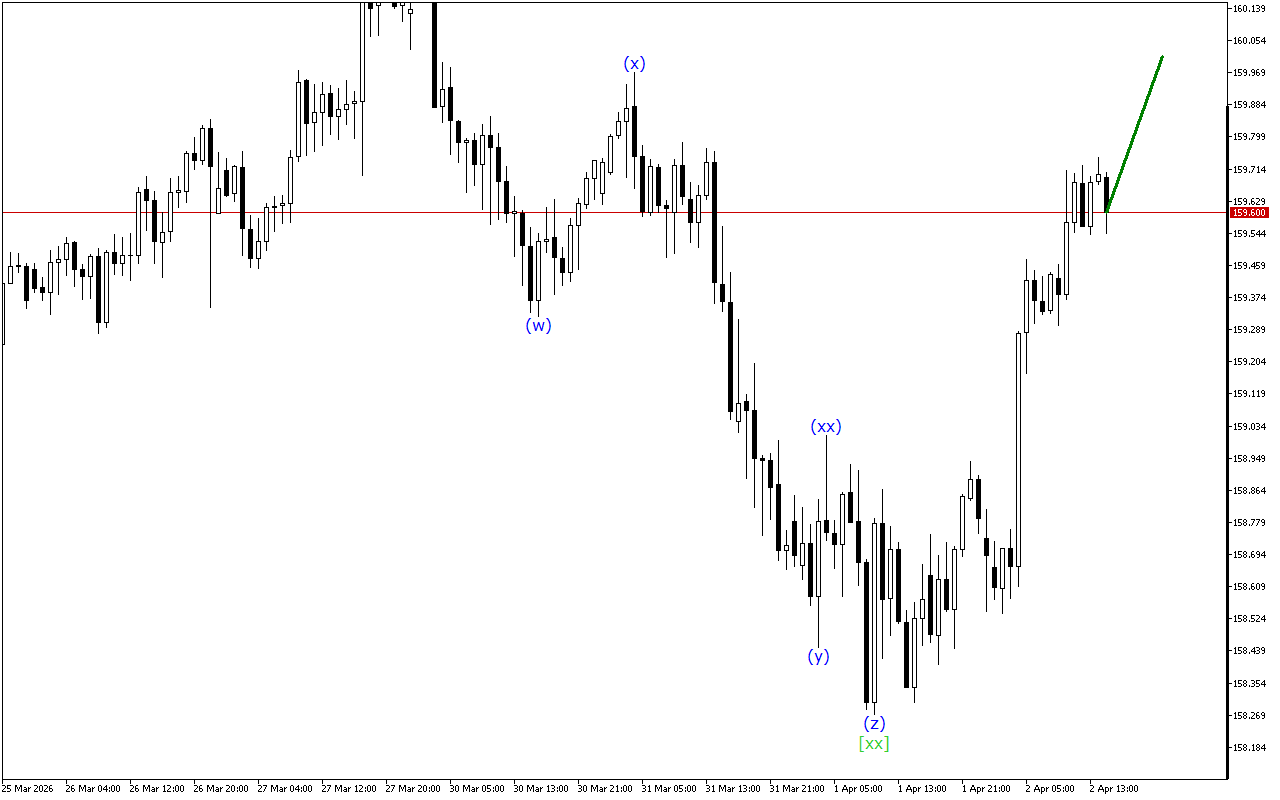
The price continues to move down, but the USDJPY chart shows signs that the downward momentum is likely to end soon.
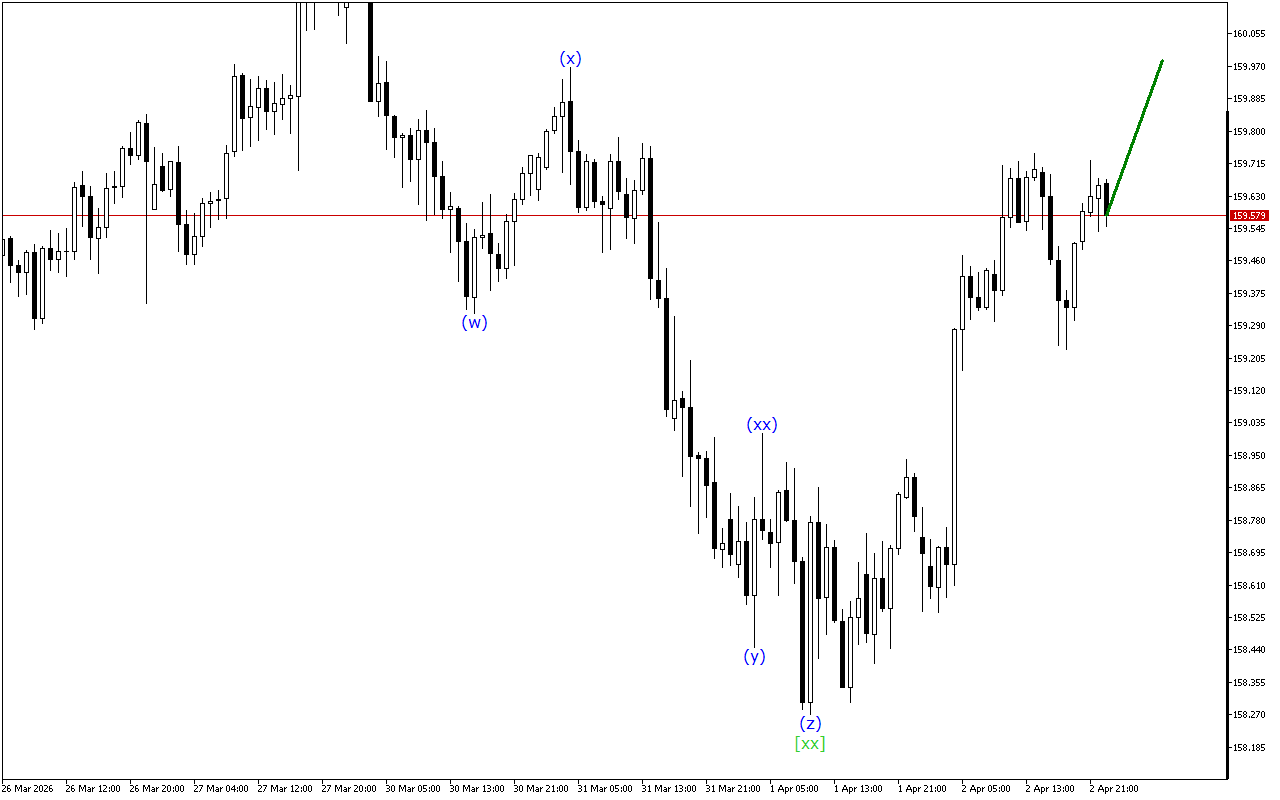
USDJPY continues to move within the Triple Three wave structure. Now, apparently, the formation of the wave [xx] has completed on the chart and the development of an upward movement can be expected with the wave [z].
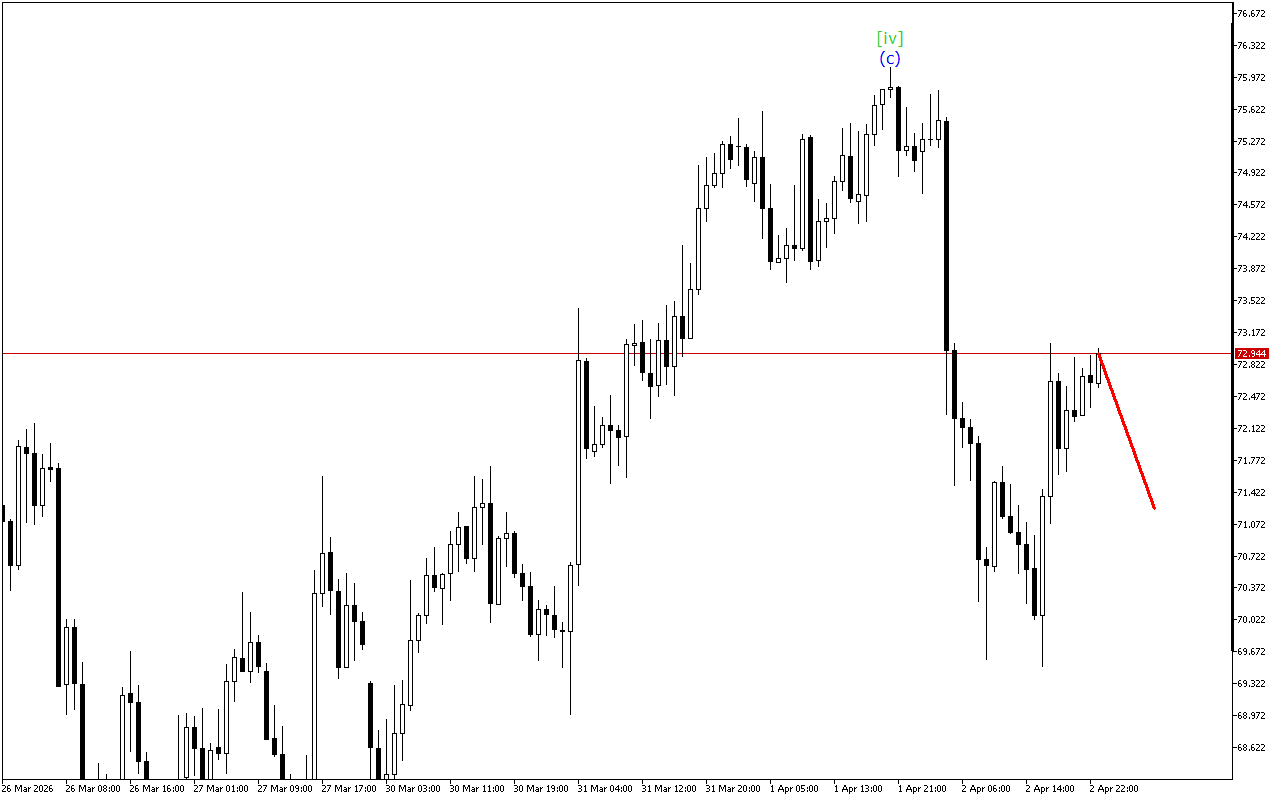
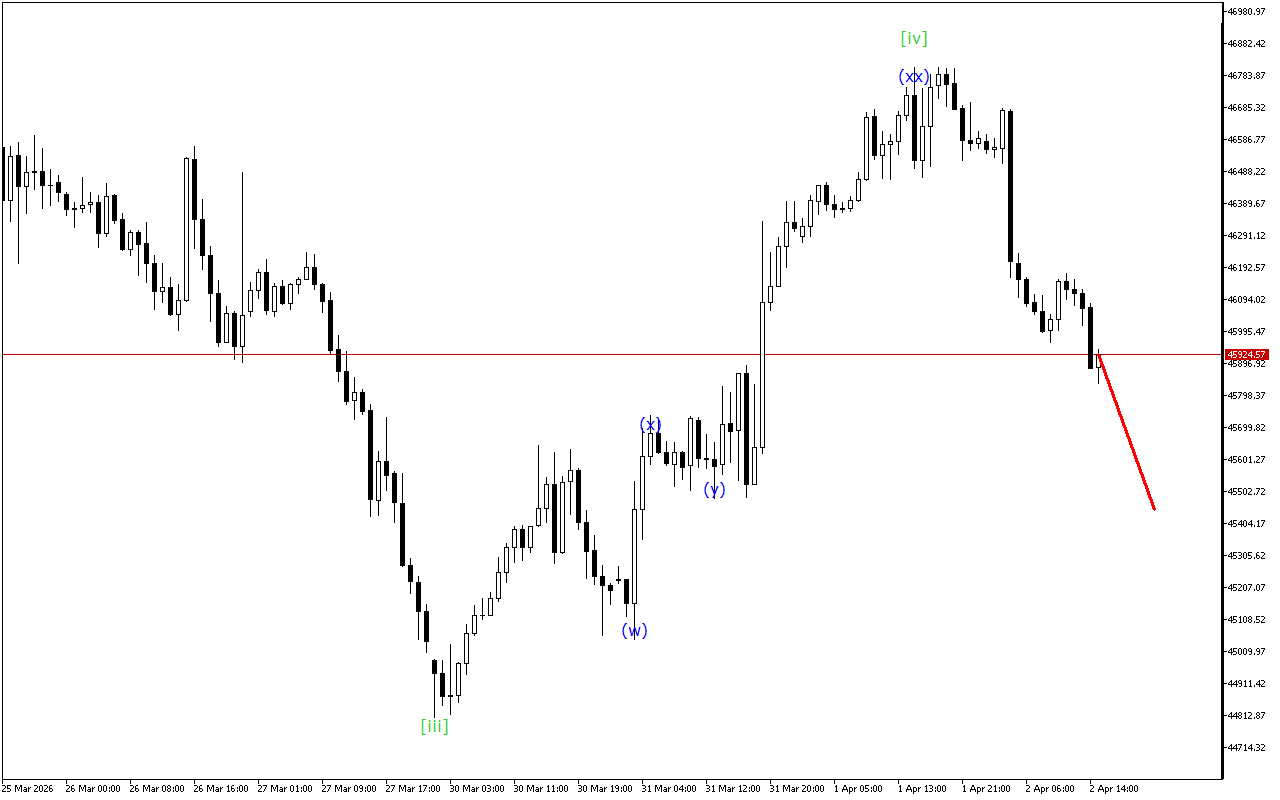
In the context of the lower-degree wave structure, the formation of the ABC zigzag is clearly seen. Once the wave (c) is fully formed, a resumption of the trend movement may be observed.
Despite the current downward movement on the USDJPY chart, the situation may change soon. The corrective wave is close to completion, which may indicate the possibility of a price reversal.
In the current situation, it is worth paying more attention to long positions.
USDJPY H1: Wave Analysis for the European Session on 21.7.2025
Related Posts
XAGUSD H1: Wave Analysis for the Asian Session on 3.4.2026
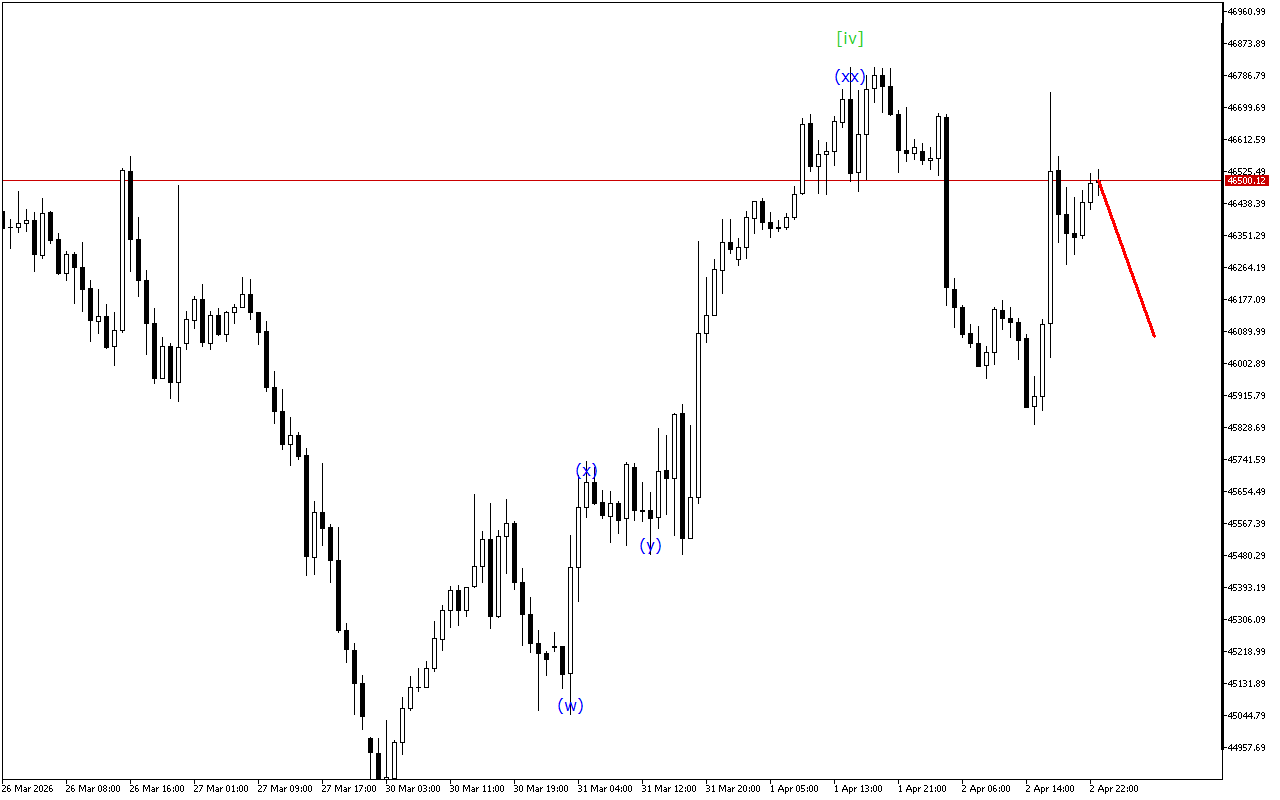
Although the market maintains an upward momentum prevalence, the XAGUSD chart shows signs of a possible end to this trend.The analysis of the wave structure indicates the development of an…
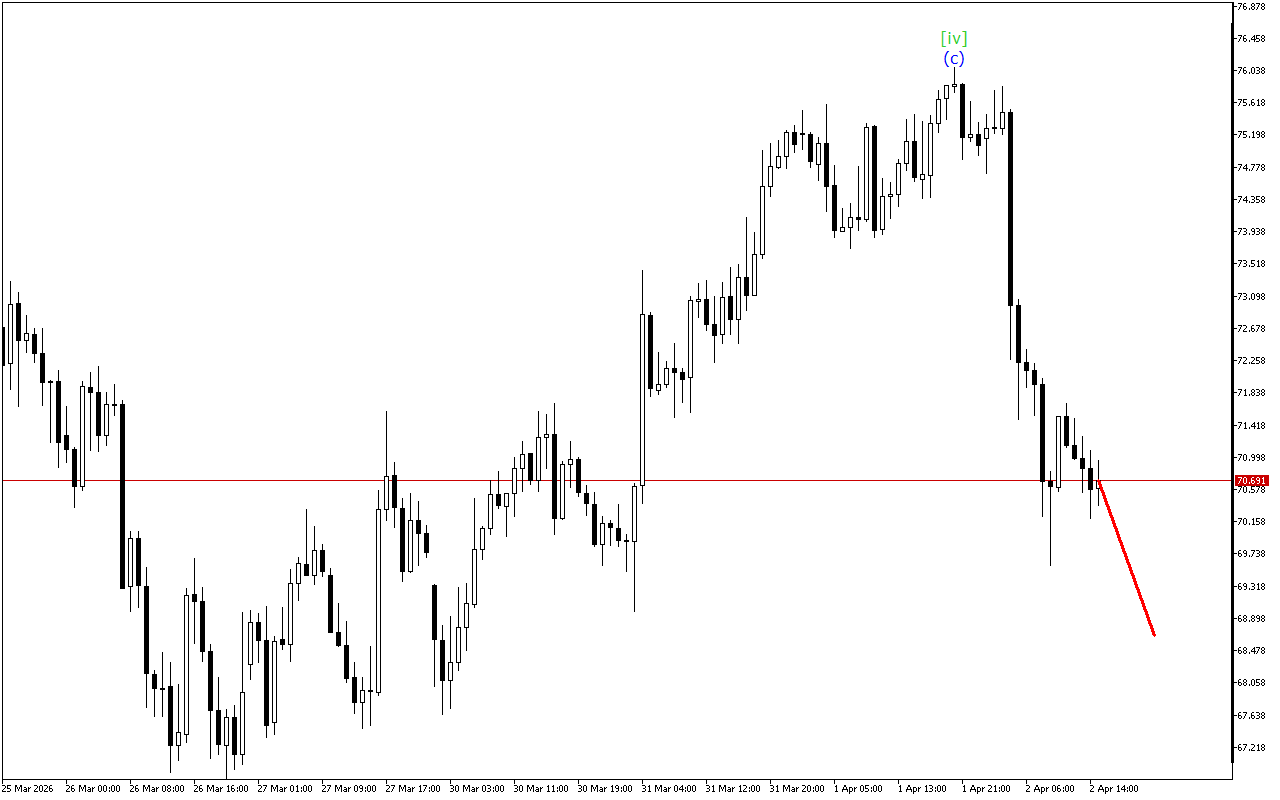
USDJPY H1: Wave Analysis for the Asian Session on 3.4.2026
The market is still heading down, but the chart shows signs that the current trend will end soon.USDJPY continues to move within the Triple Three wave structure. Now, apparently, the…