

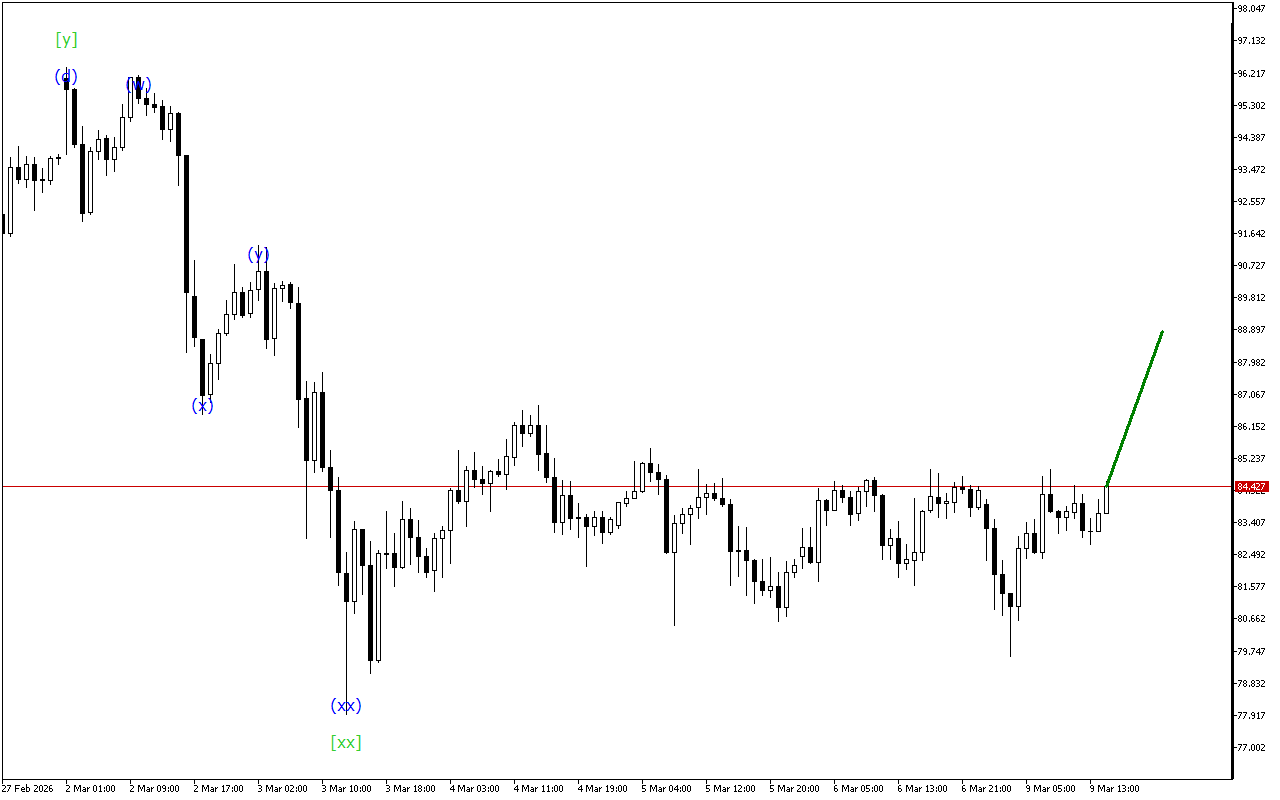
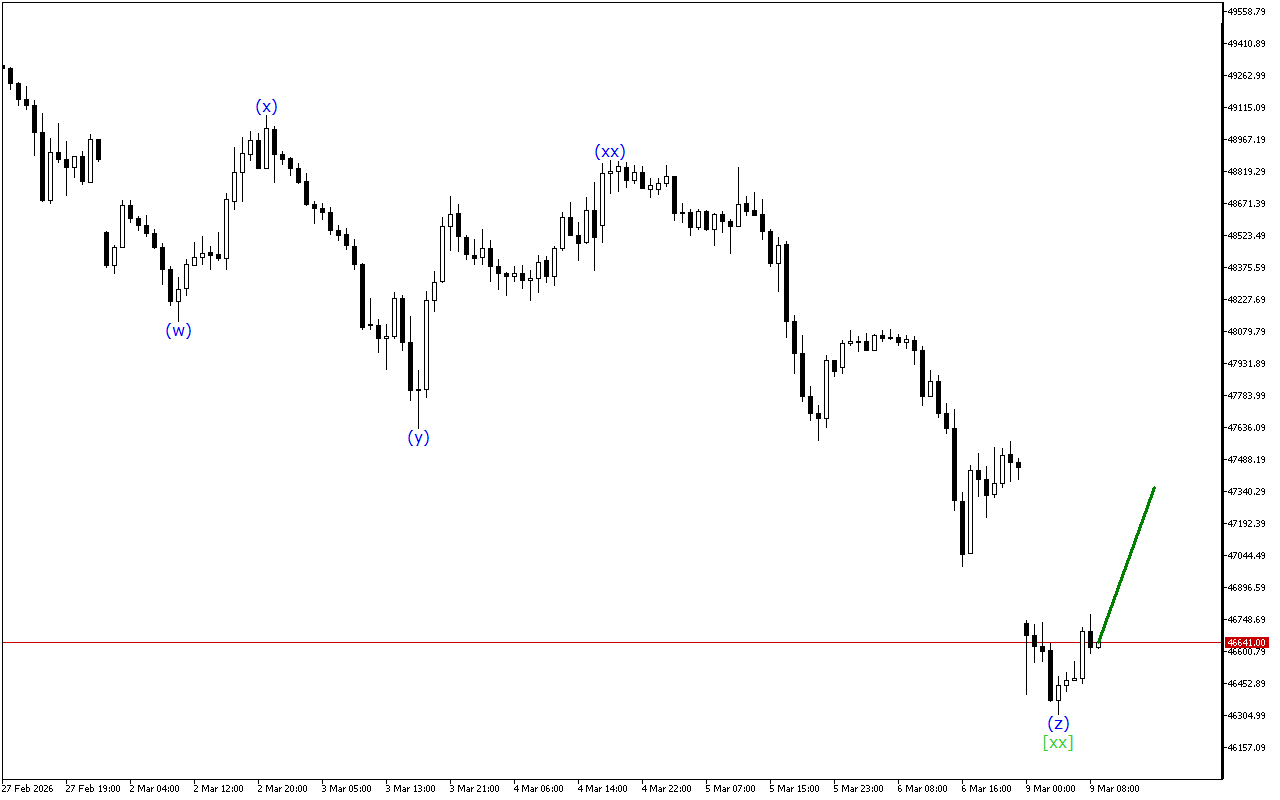
Despite the steady decline in price, the USDJPY chart is giving signals about a possible completion of the current bearish momentum.
The medium-term movement vector of USDJPY indicates the formation of a Triple Three wave structure. Now the formation of the wave [xx] is completed and the beginning of an upward movement within the wave [z] is expected.
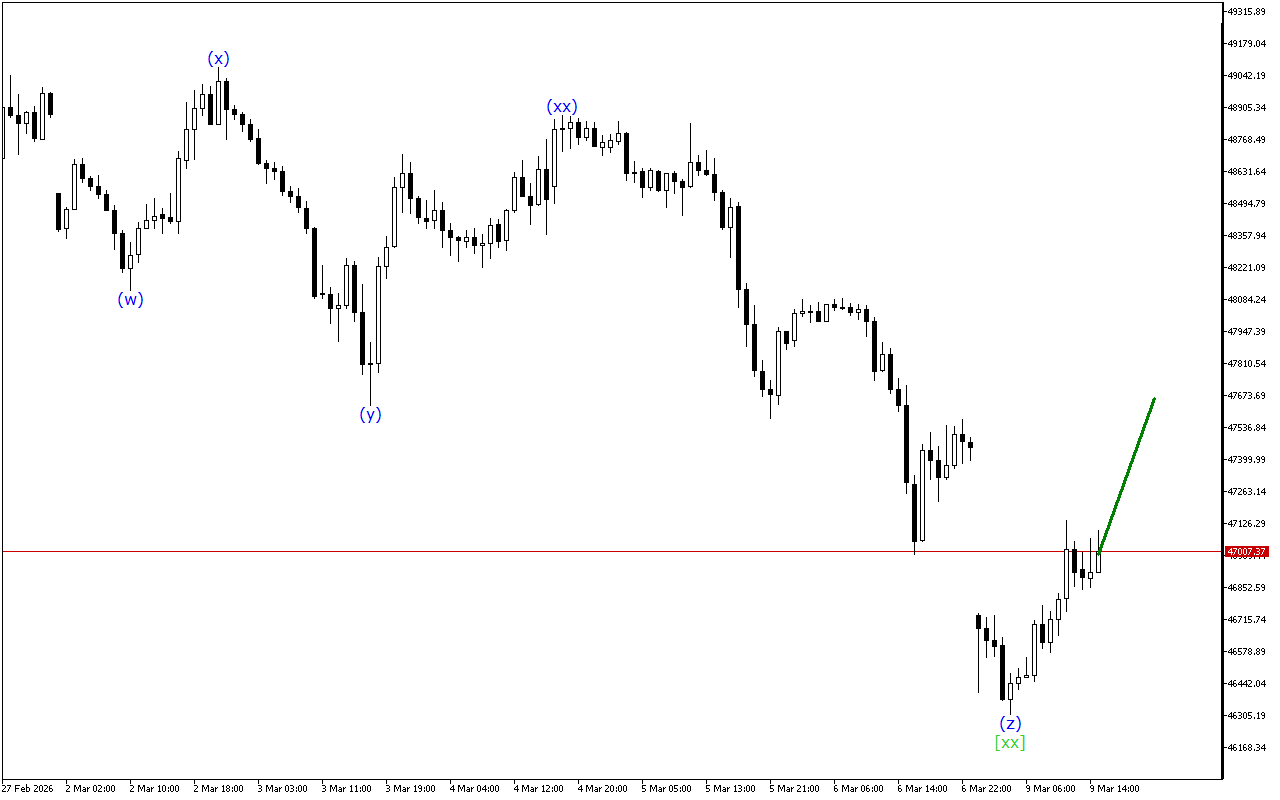
Waves of a lower time-frame form a triple three. The price is currently in the wave (z). When this wave is completed, a more directional price movement is expected.
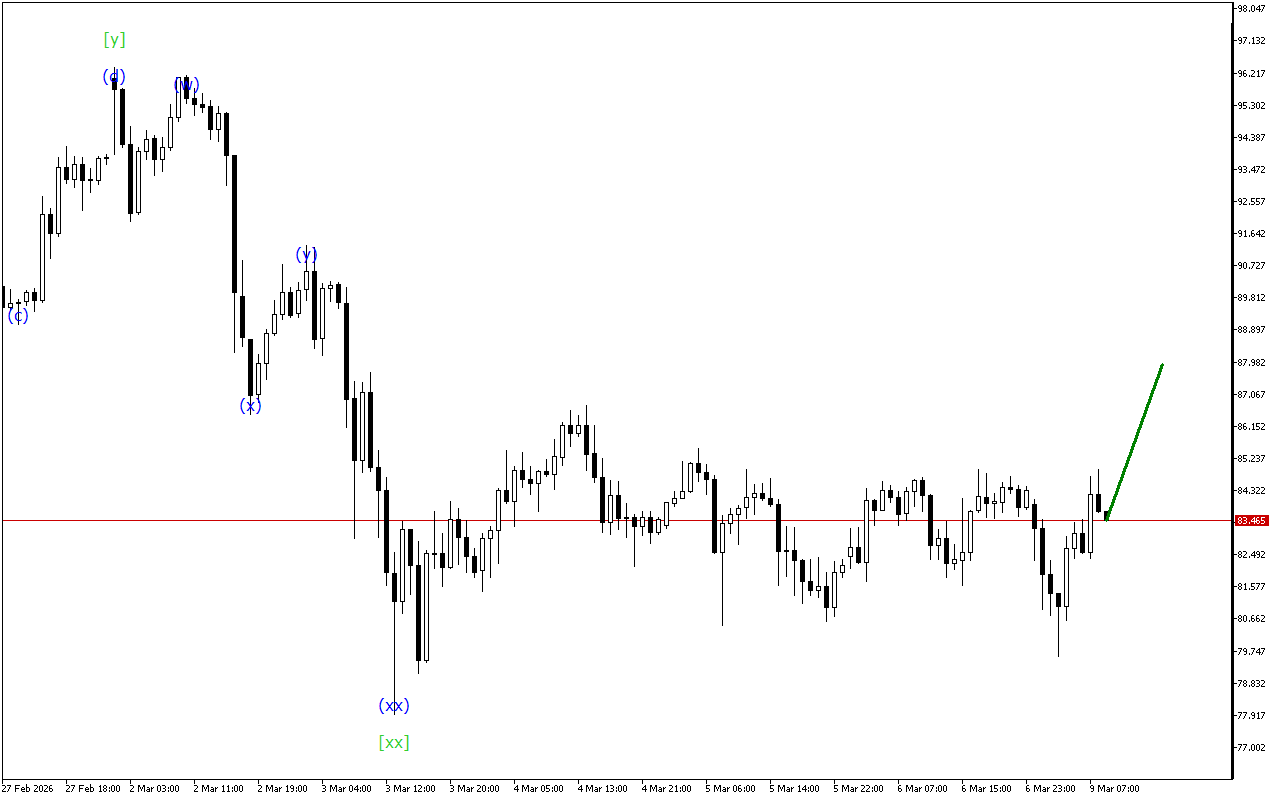
To summarize, at the moment the USDJPY chart is maintaining a downward movement vector. However, the corrective wave is in the final stage of formation.
In this situation, long positions are prioritized.
Альтернативный сценарий
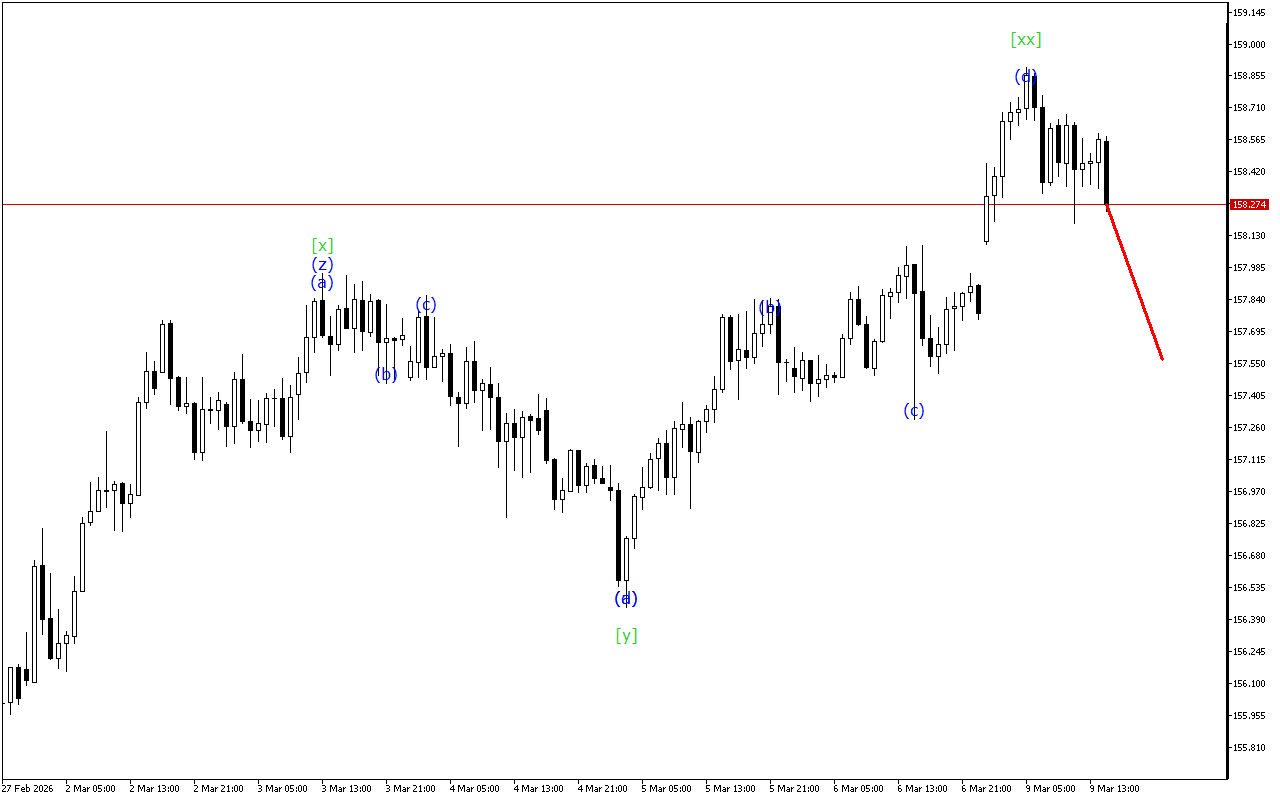
USDJPY H1: Wave Analysis for the Asian Session on 31.12.2025
Related Posts
XAGUSD H1: Wave Analysis for the American Session on 9.3.2026
Despite the steady decline in price, the XAGUSD chart is giving signals about a possible completion of the current bearish momentum.The medium-term movement vector of XAGUSD indicates the formation of…
USDJPY H1: Wave Analysis for the American Session on 9.3.2026
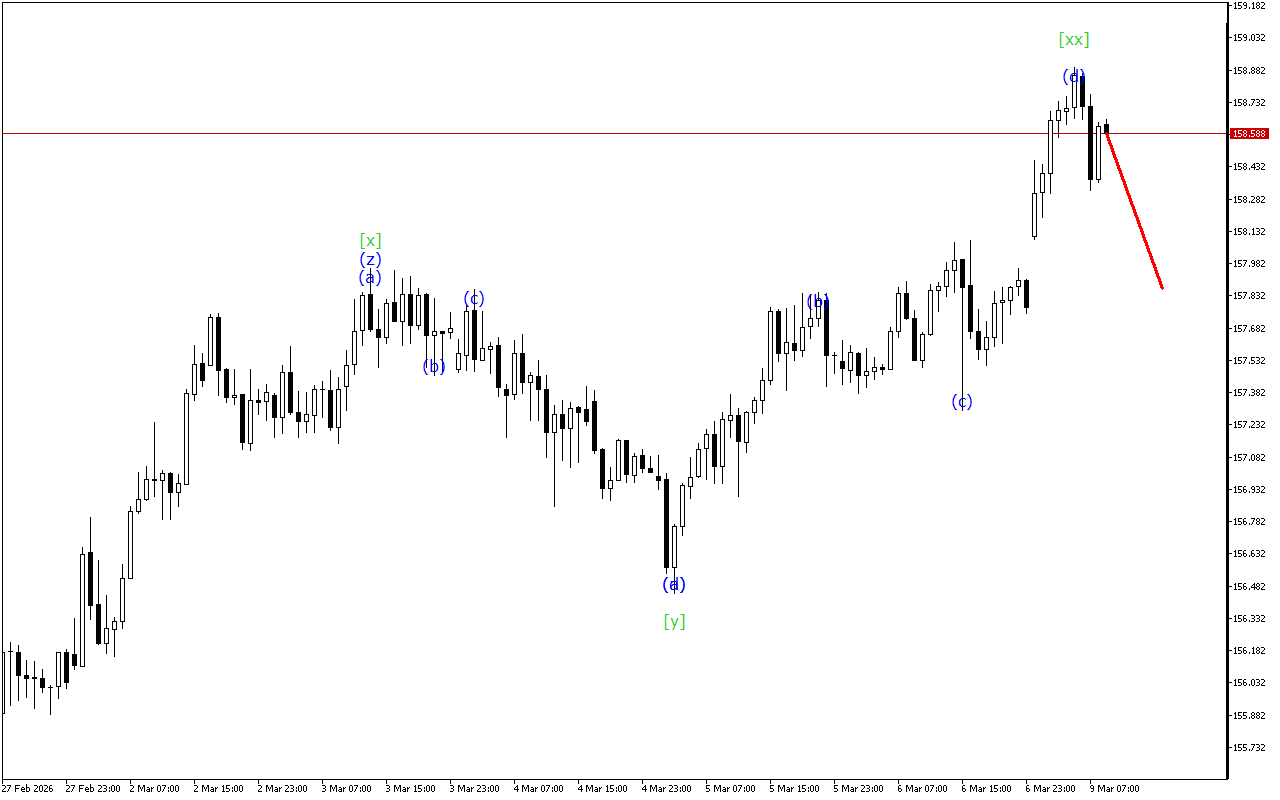
The price continues to move upward, but on the USDJPY chart you can see signs of an impending completion of the current upward momentum.The current dynamics of the movement indicate…