

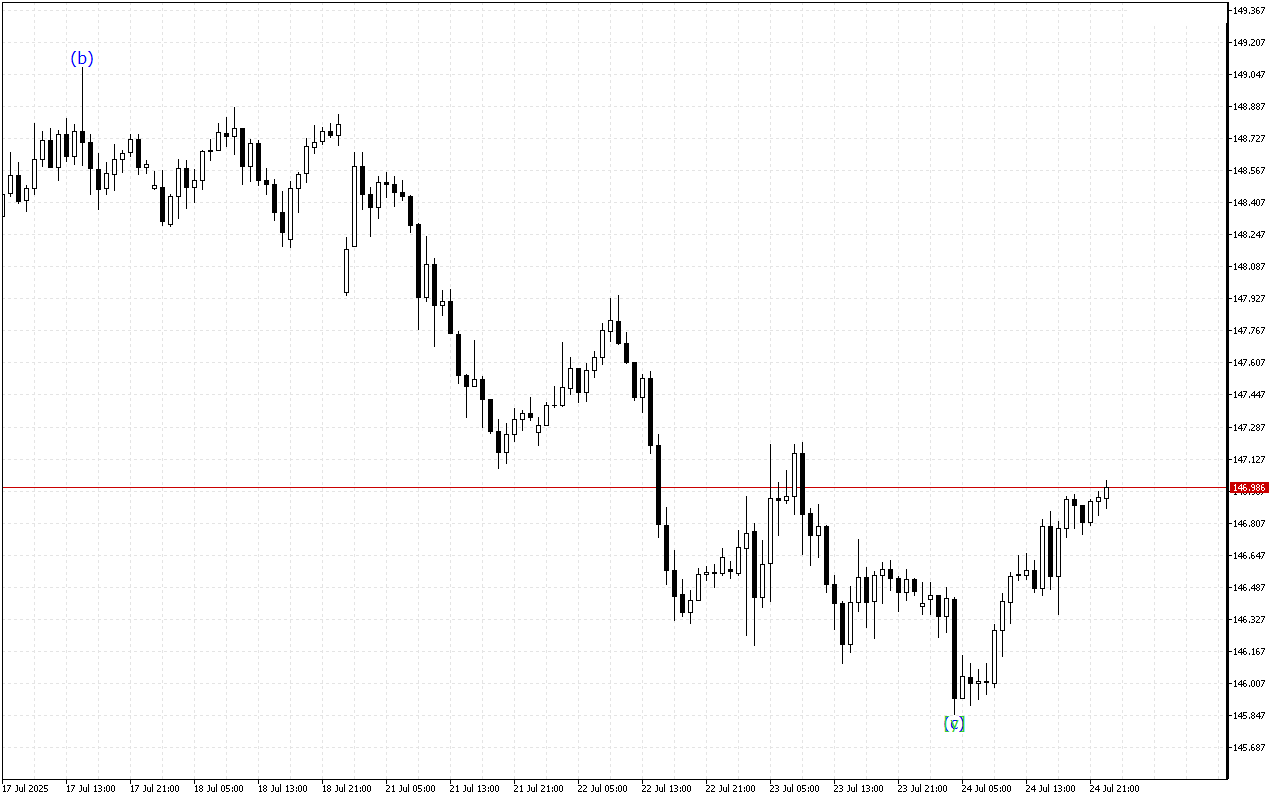
The USDJPY chart shows mixed trading dynamics, with periods of both positive and negative price activity.
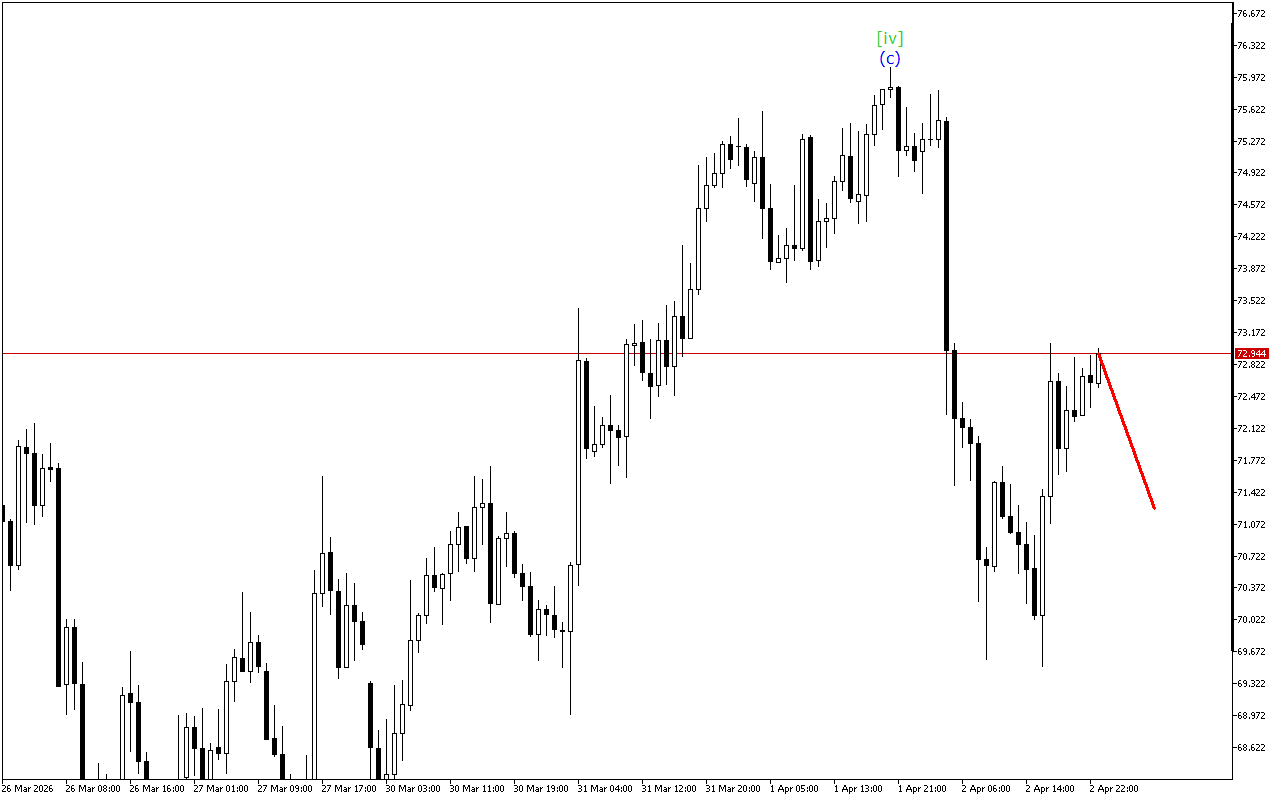
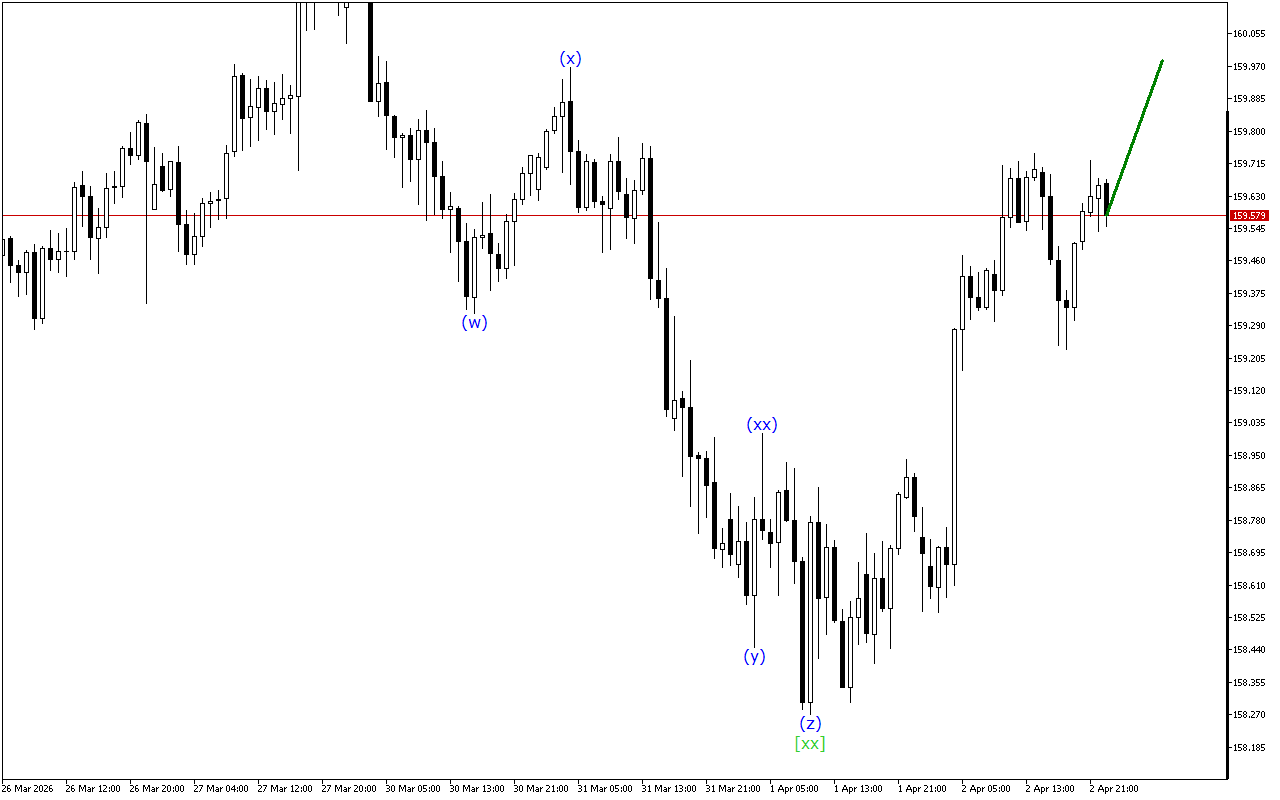
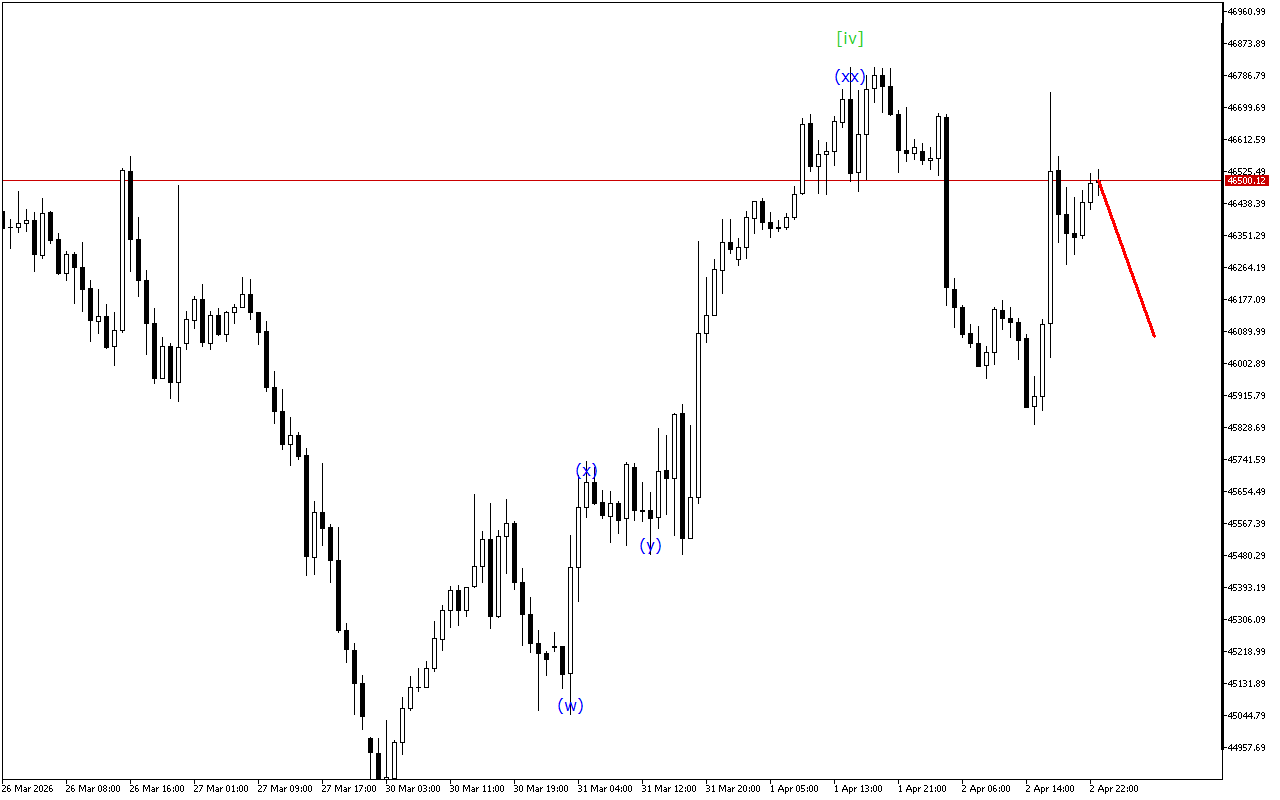
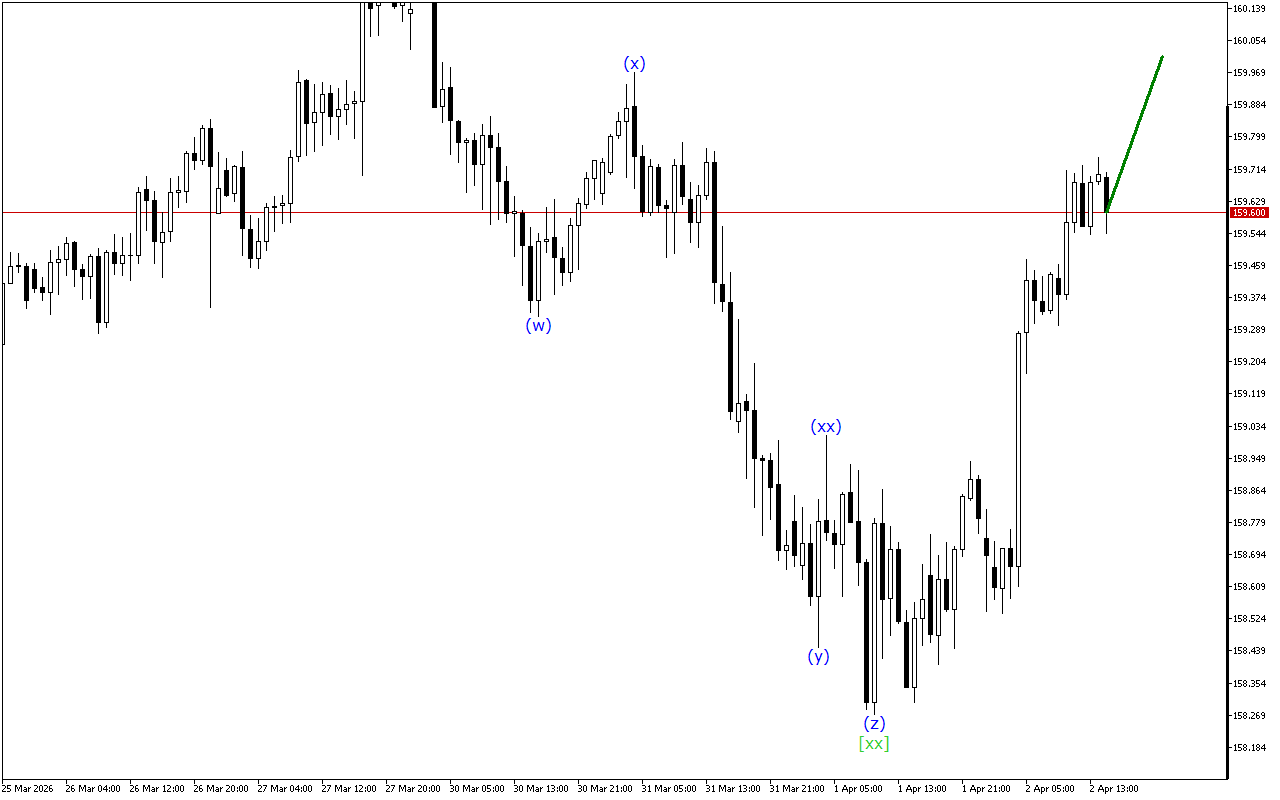
An analysis of the higher wave structure shows the formation of a WXY double three, with the development of the final wave [y]. After this, the development of a more directional price movement or the formation of a more complex five-wave structure can be expected.
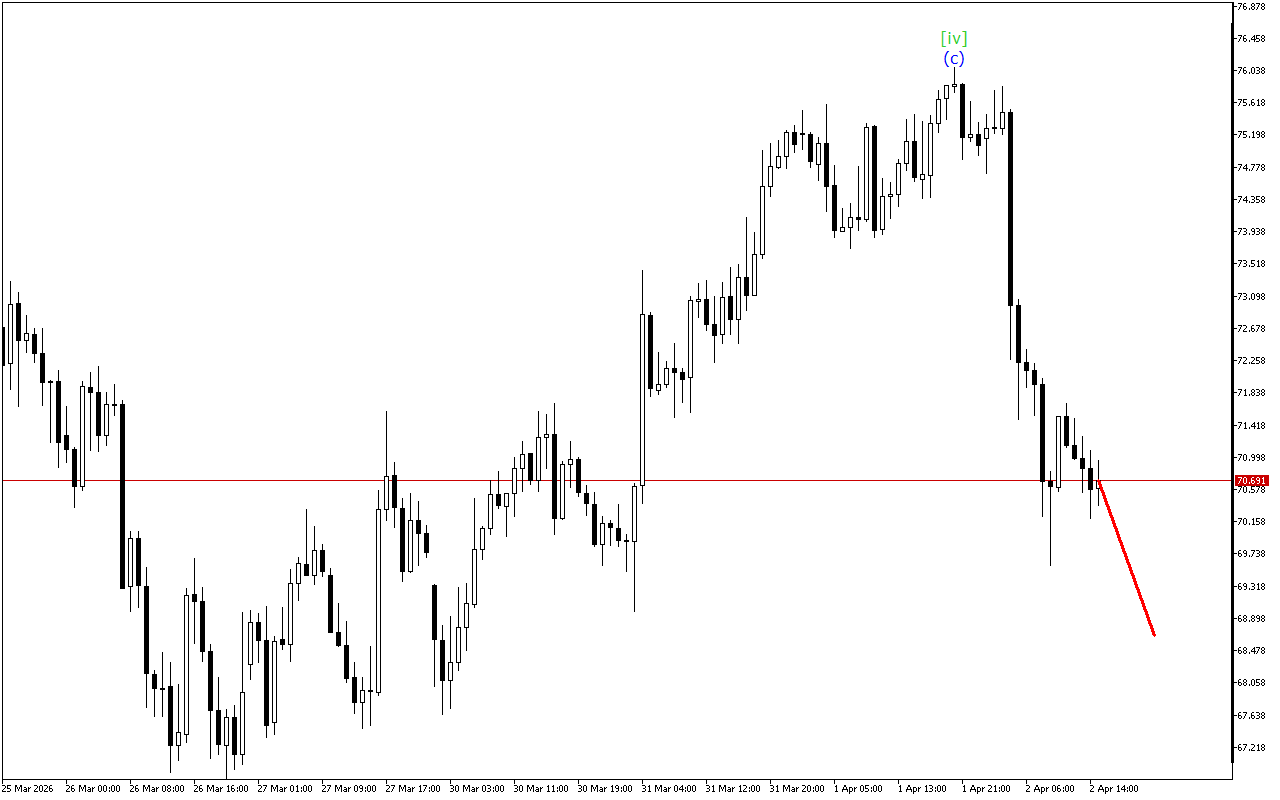
Lower-degree waves indicate the formation of a downward ABC zigzag. The wave (c) must have already been completed, so the formation of a new wave structure can be expected.
Analysis shows that the market dynamics are characterized by mixed signals over a longer distance. In such conditions, it is worth waiting for the current wave to complete its formation.
In the current situation, it’s wise to hold off on making any trading decisions.