

The USDJPY chart shows mixed trading dynamics, with periods of both positive and negative price activity.
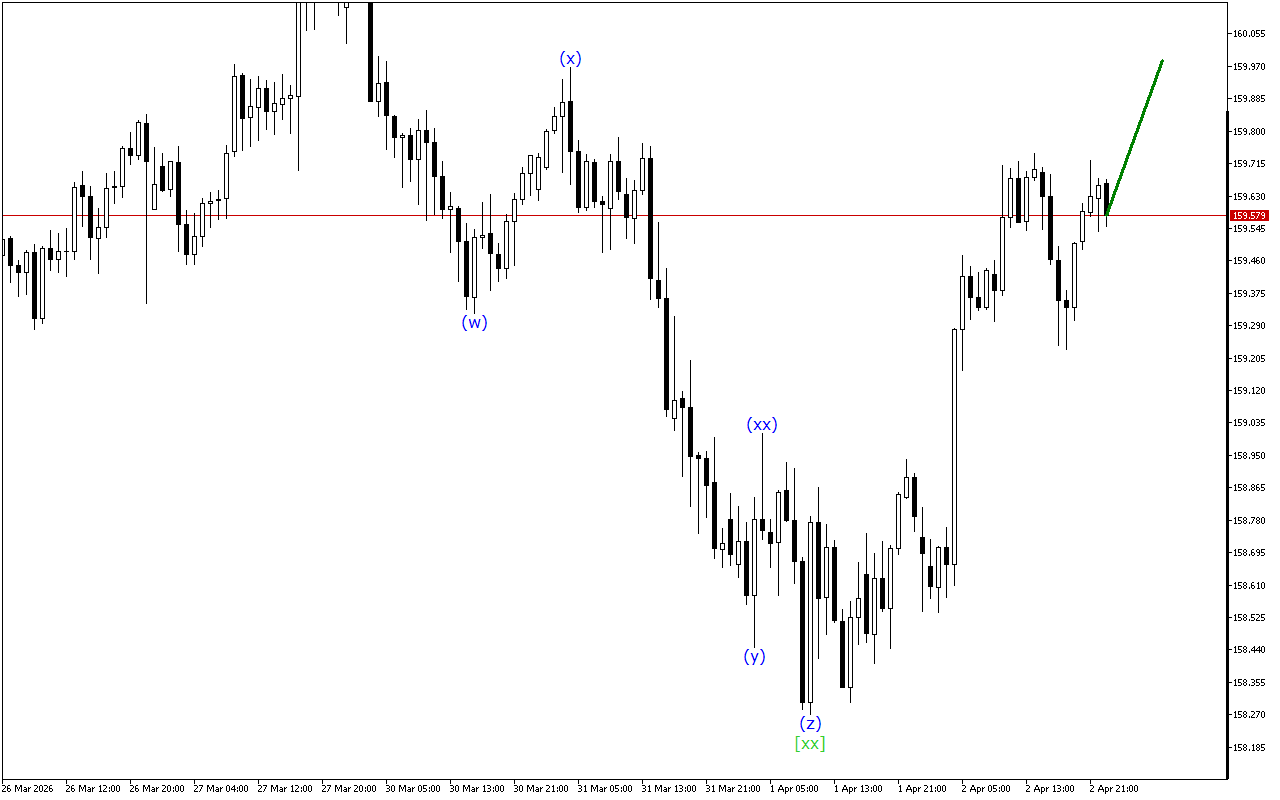
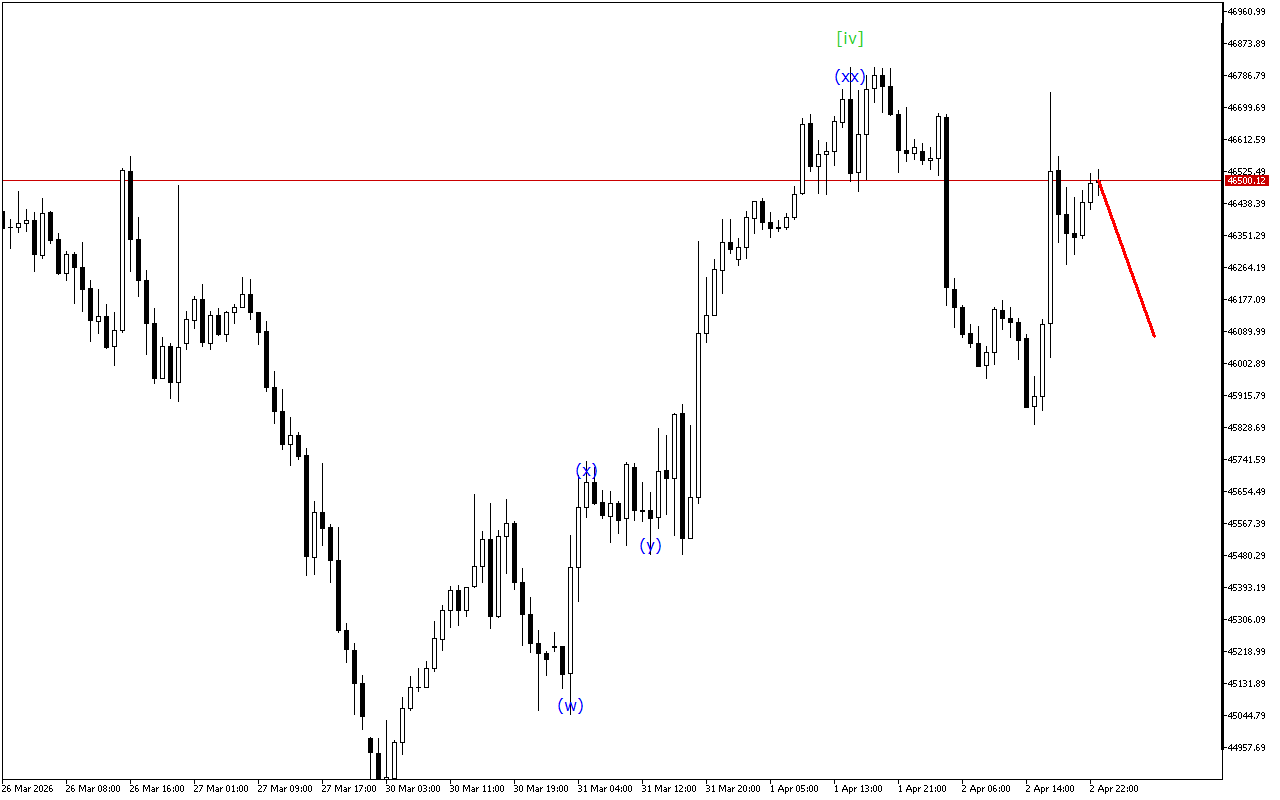
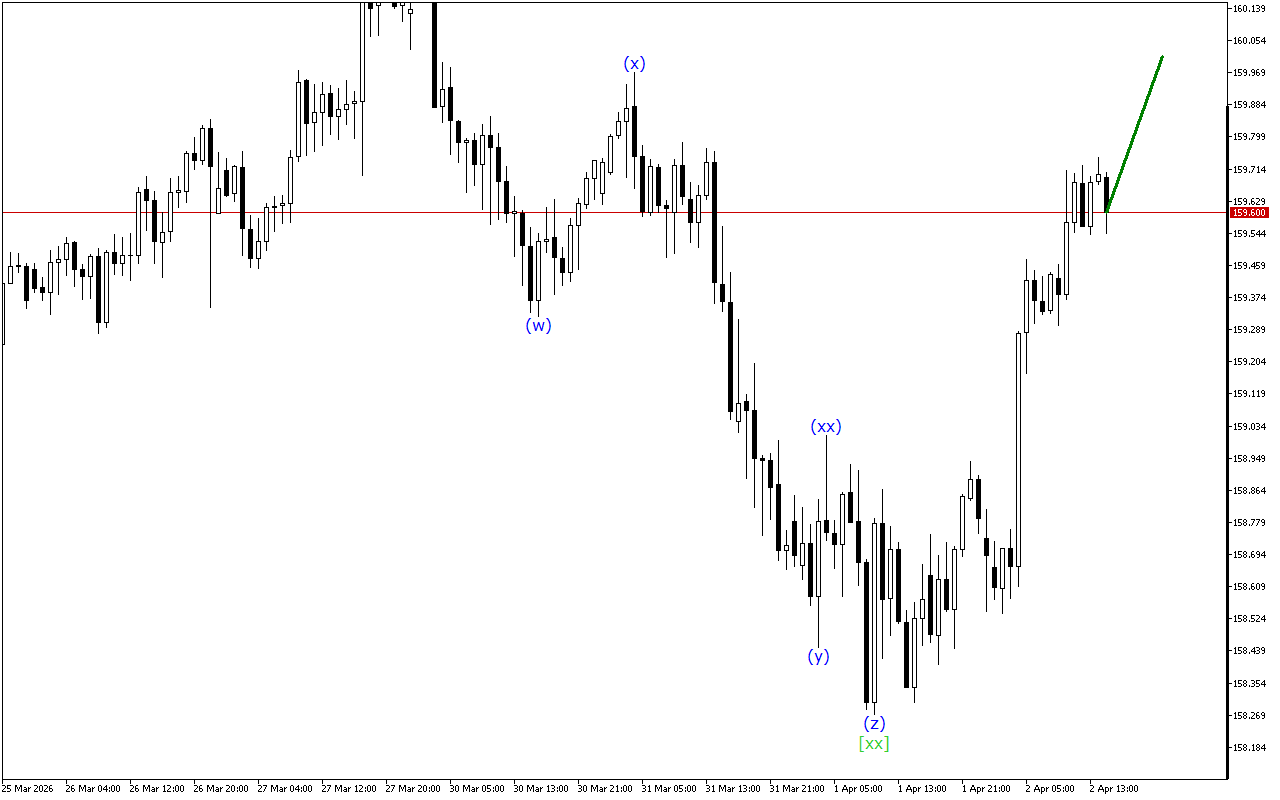
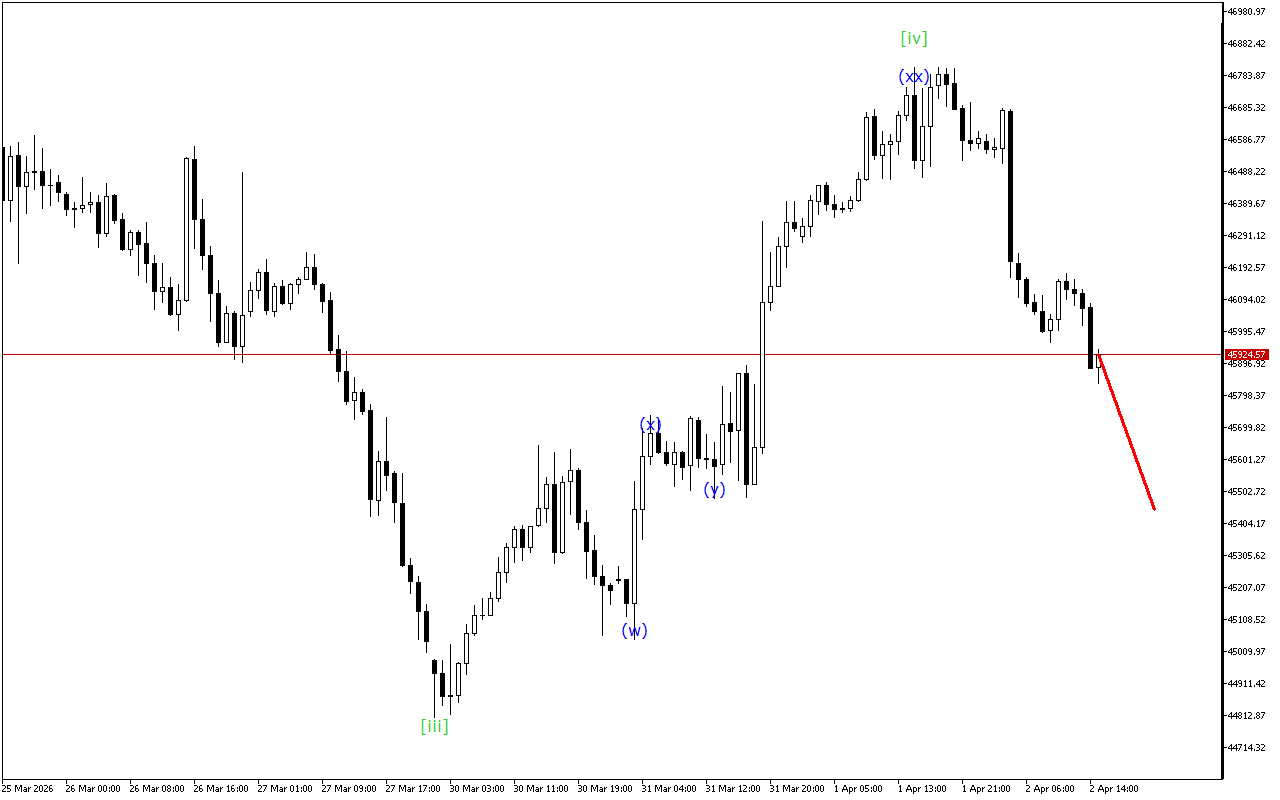
The current wave structure is hinting at the formation of a WXY double three where there is the final wave [y].
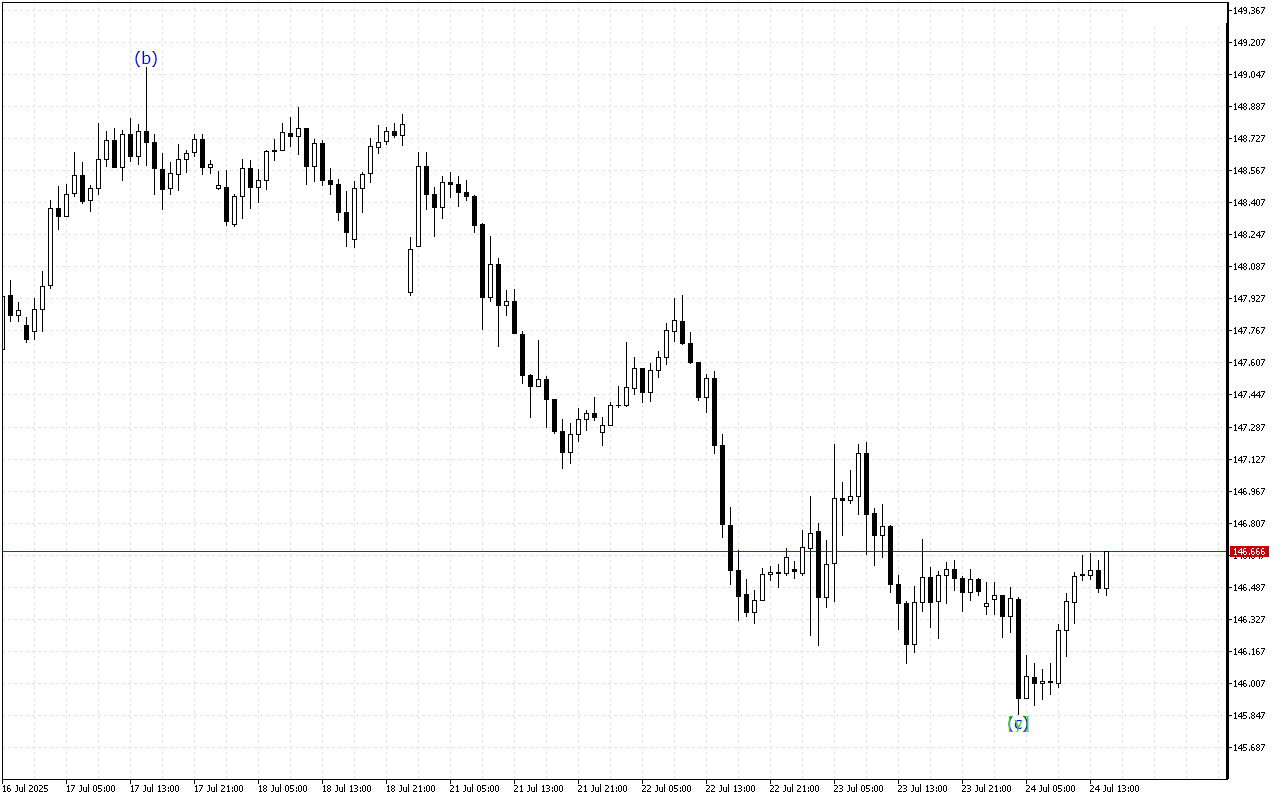
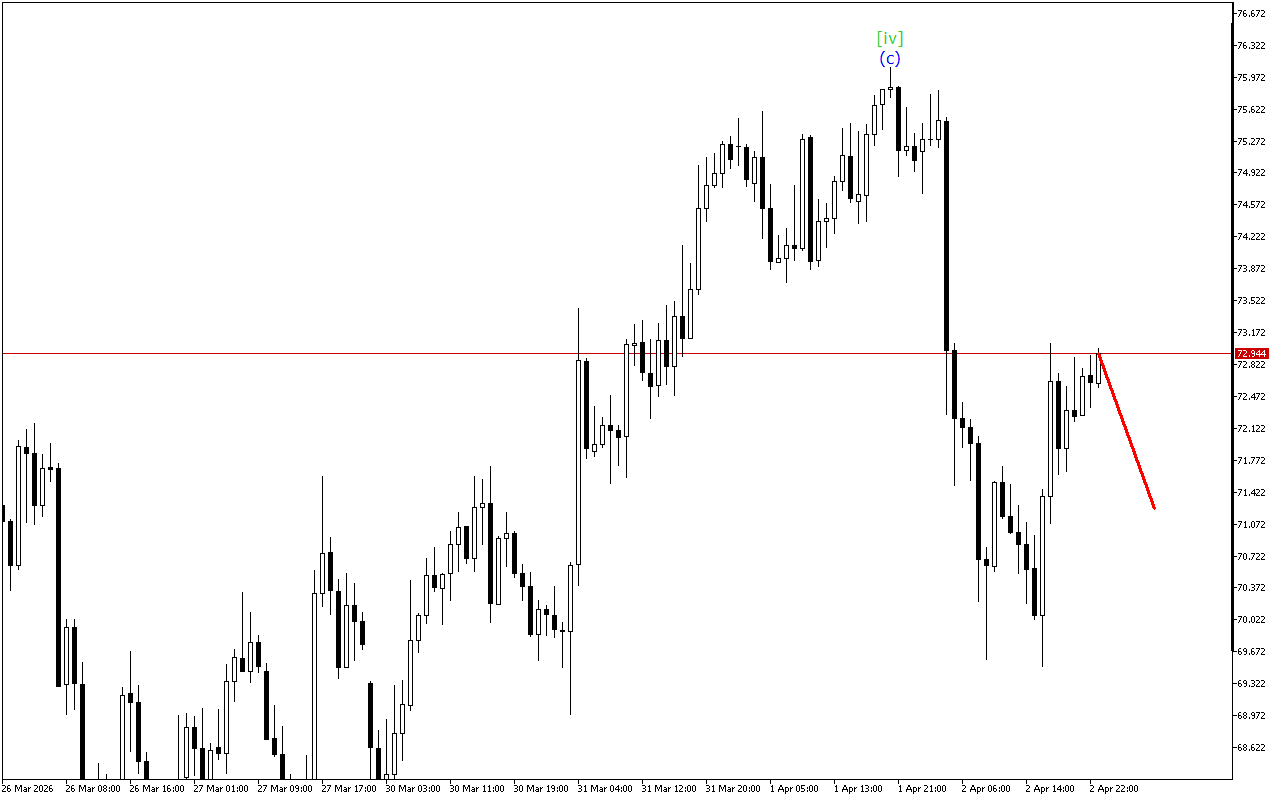
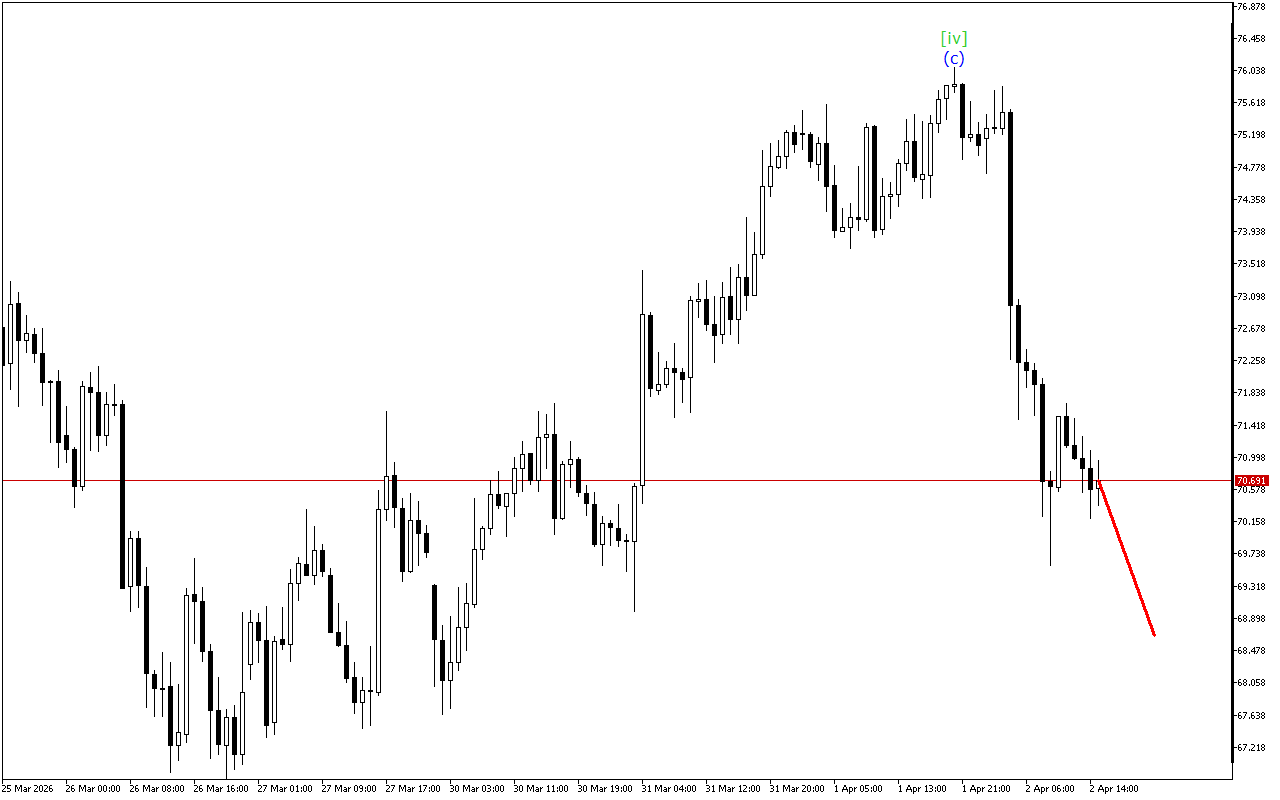
According to a smaller time-frame, the market moves within the ABC zigzag. Currently, the price is completing the formation of the wave (c) apparently and the price movement may move into a new wave formation.
To summarize, it can be noted that the market shows mixed dynamics over a longer period. In this situation, it is worth waiting for the current wave to complete its formation.
In the current environment, it’s advisable to avoid making significant trading moves.