

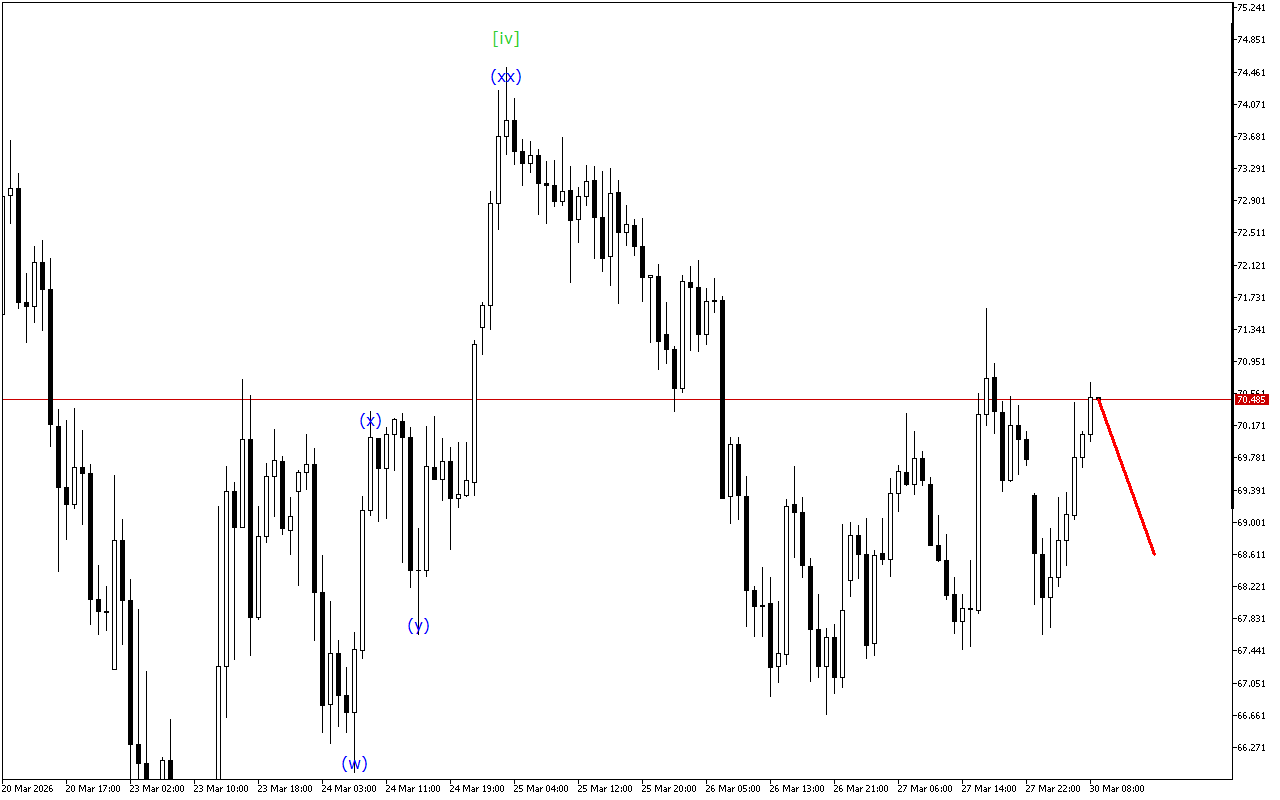
Although the market maintains an upward momentum prevalence, the XAGUSD chart shows signs of a possible end to this trend.
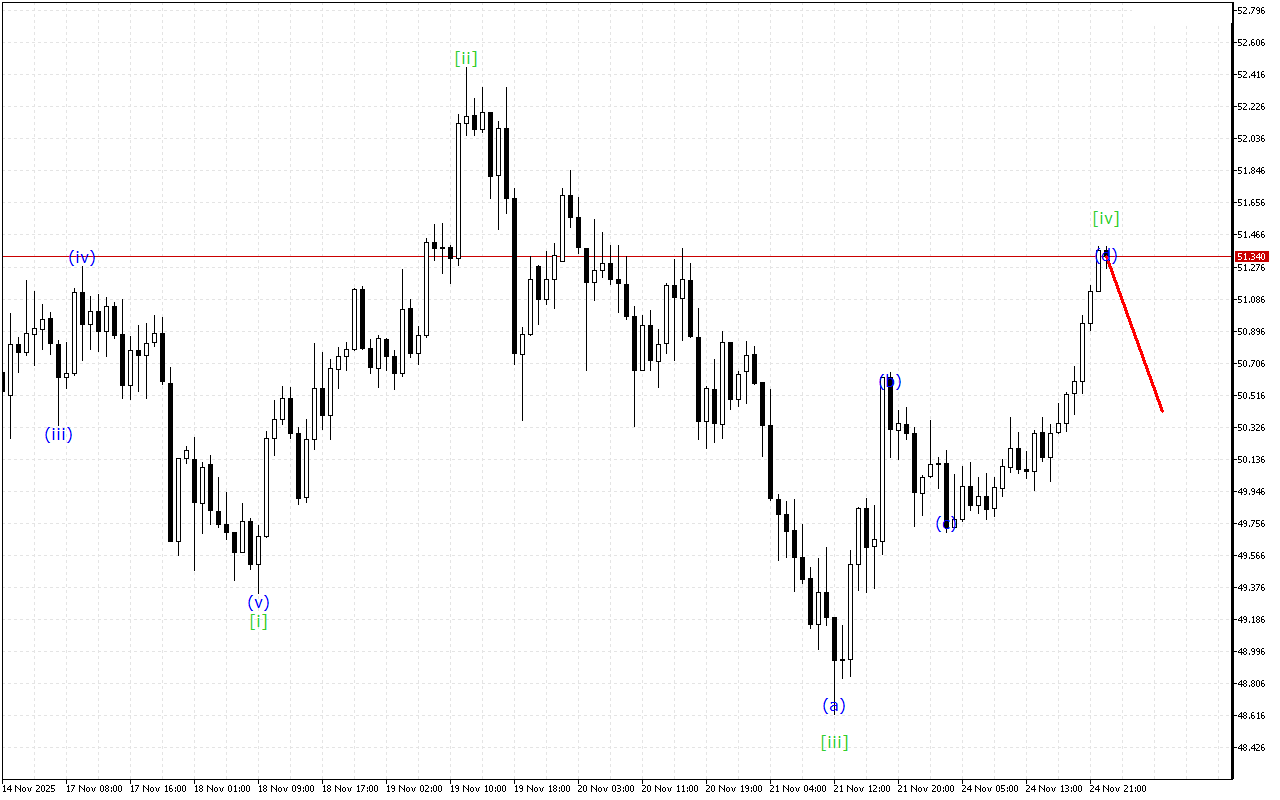
The analysis of the higher degree wave structure shows a falling wedge. Within this five-wave formation, the formation of the wave [iv] is completed and the resumption of downward movement within the wave [v] is expected.
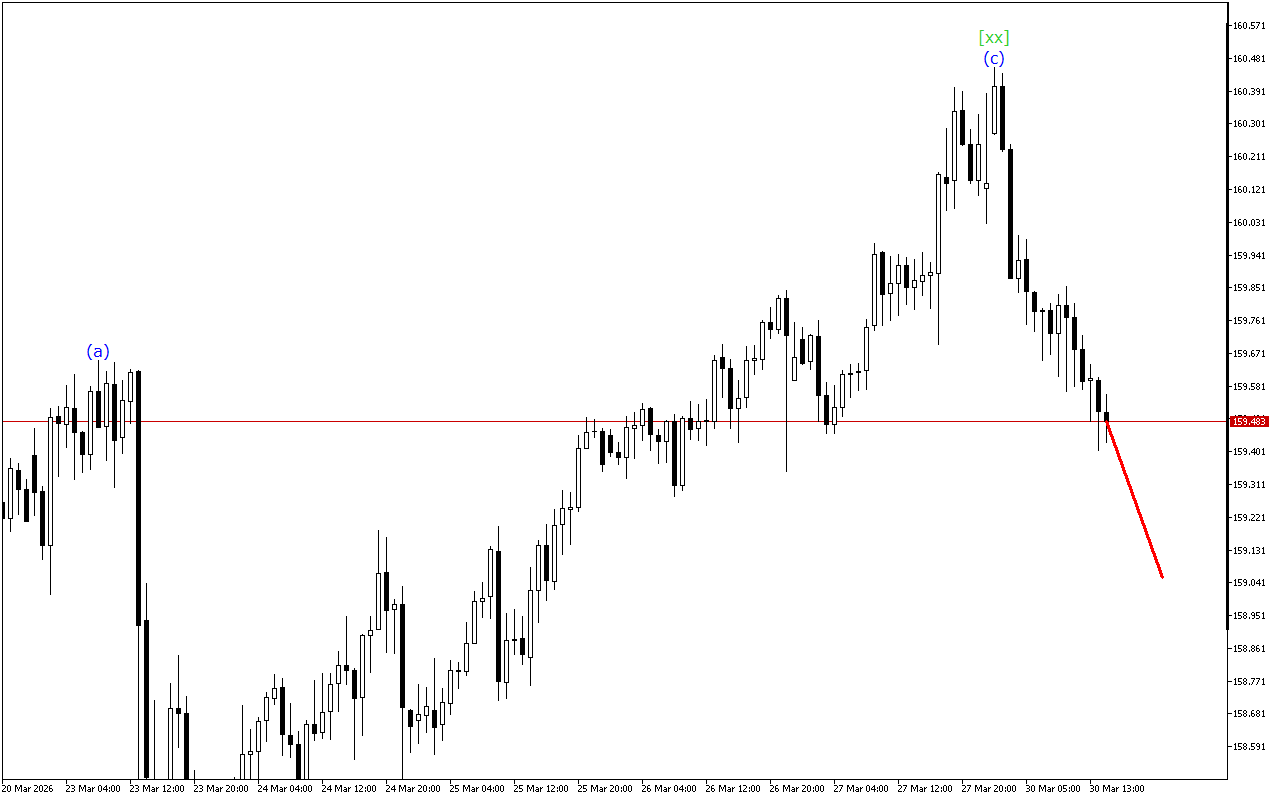
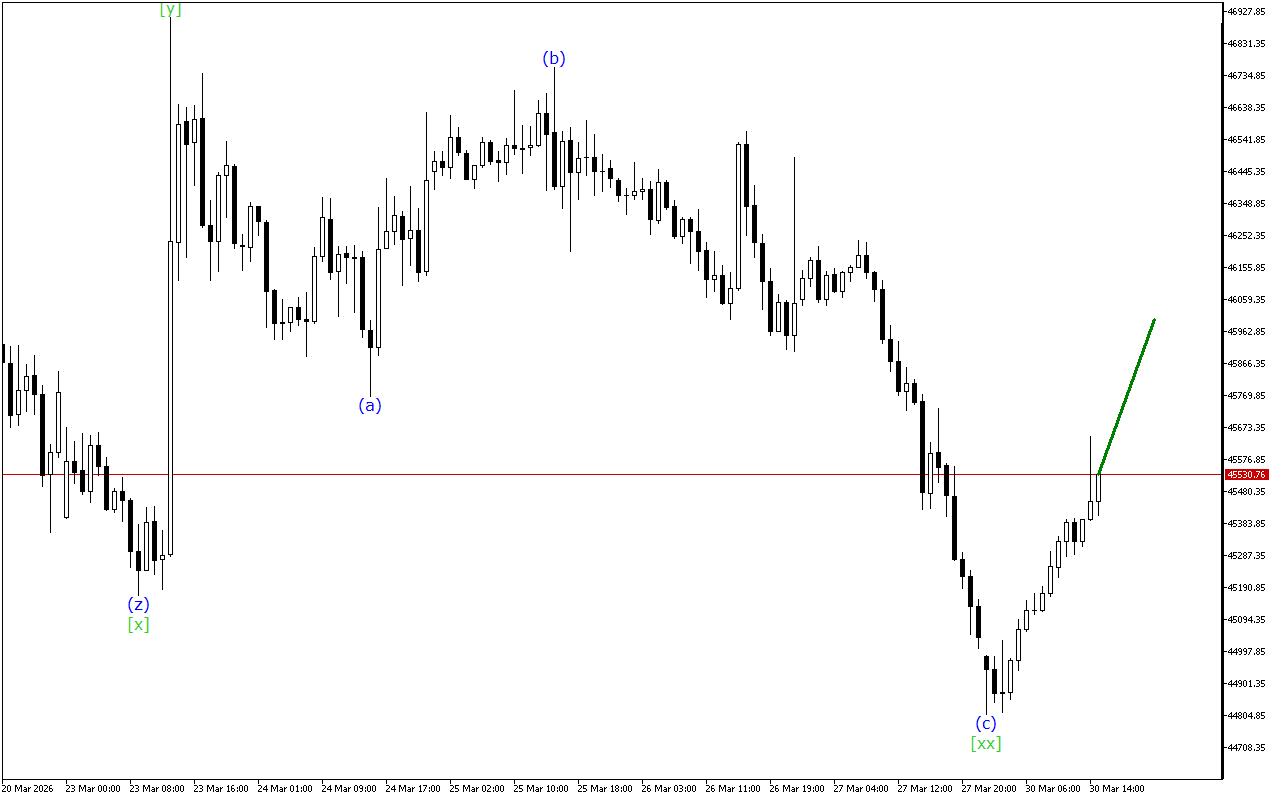
In the context of the lower-degree wave structure, the formation of the ABC zigzag is clearly seen. Once the wave (c) is fully formed, a resumption of the trend movement may be observed.
Thus, an upward movement continues to form on the XAGUSD chart, but this impulse is at the final stage of formation so the price may resume a downward movement.
In this case, the emphasis is on short positions that can be considered at current levels.