

Although the market maintains an upward momentum prevalence, the XAGUSD chart shows signs of a possible end to this trend.
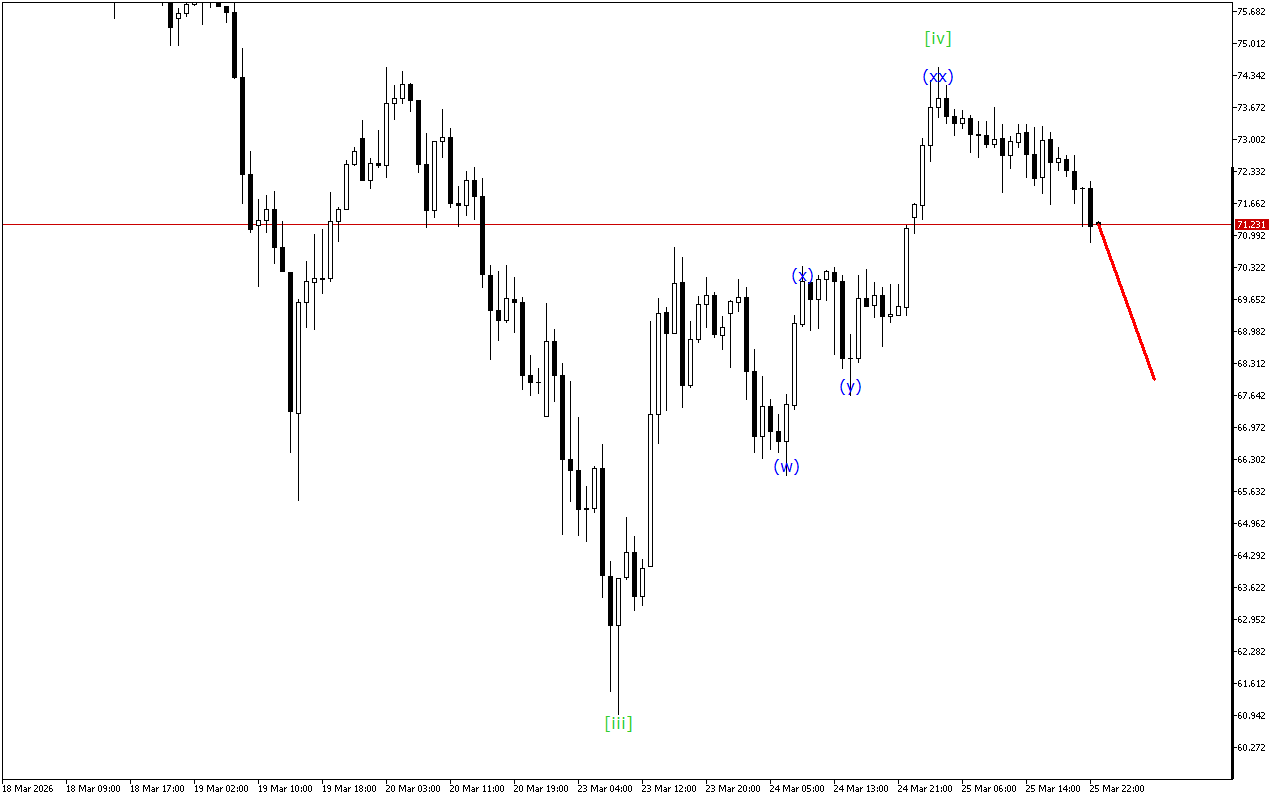
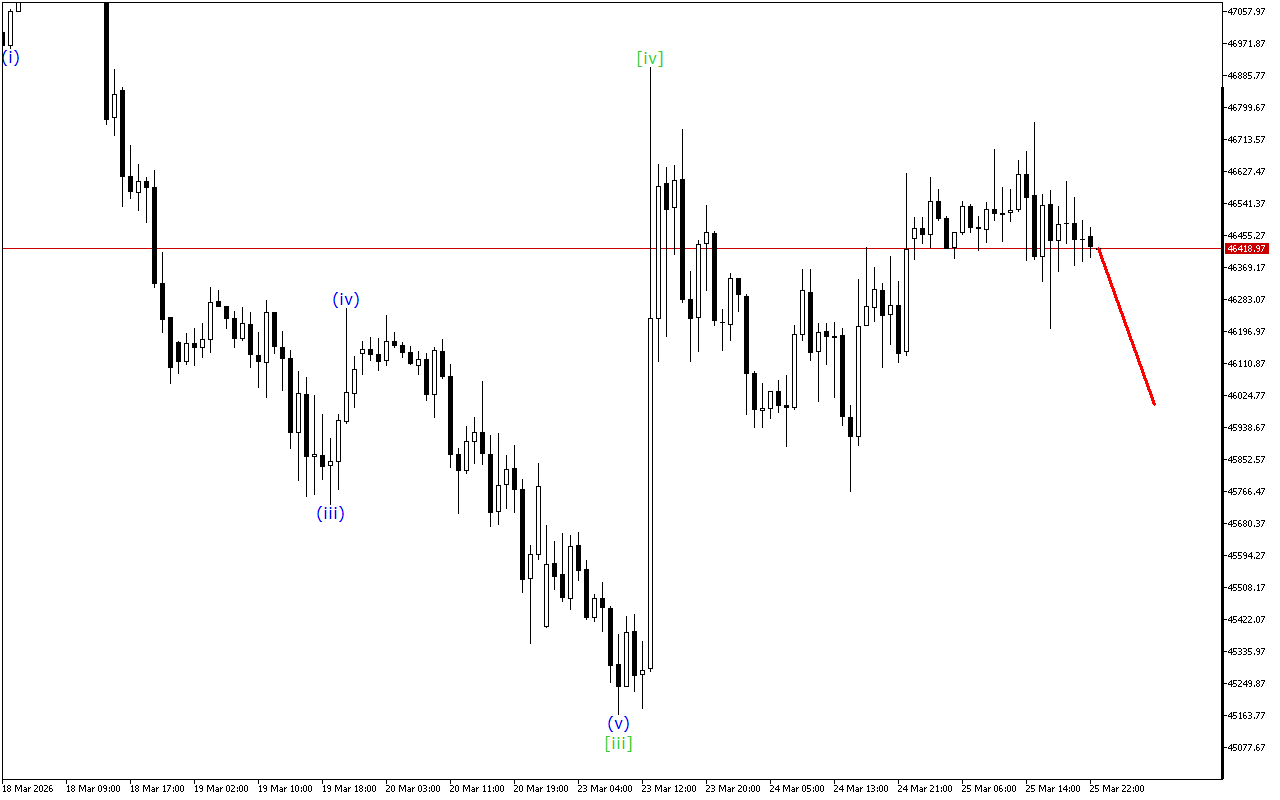
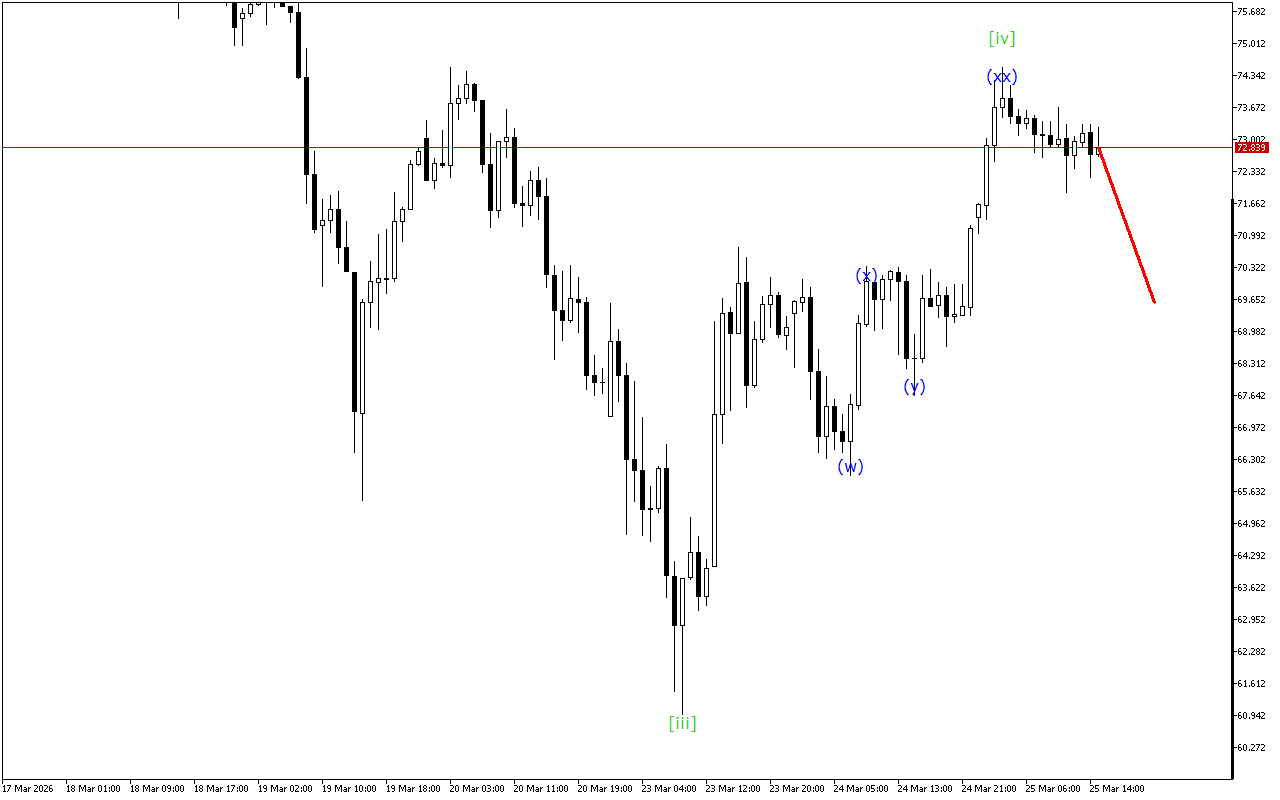
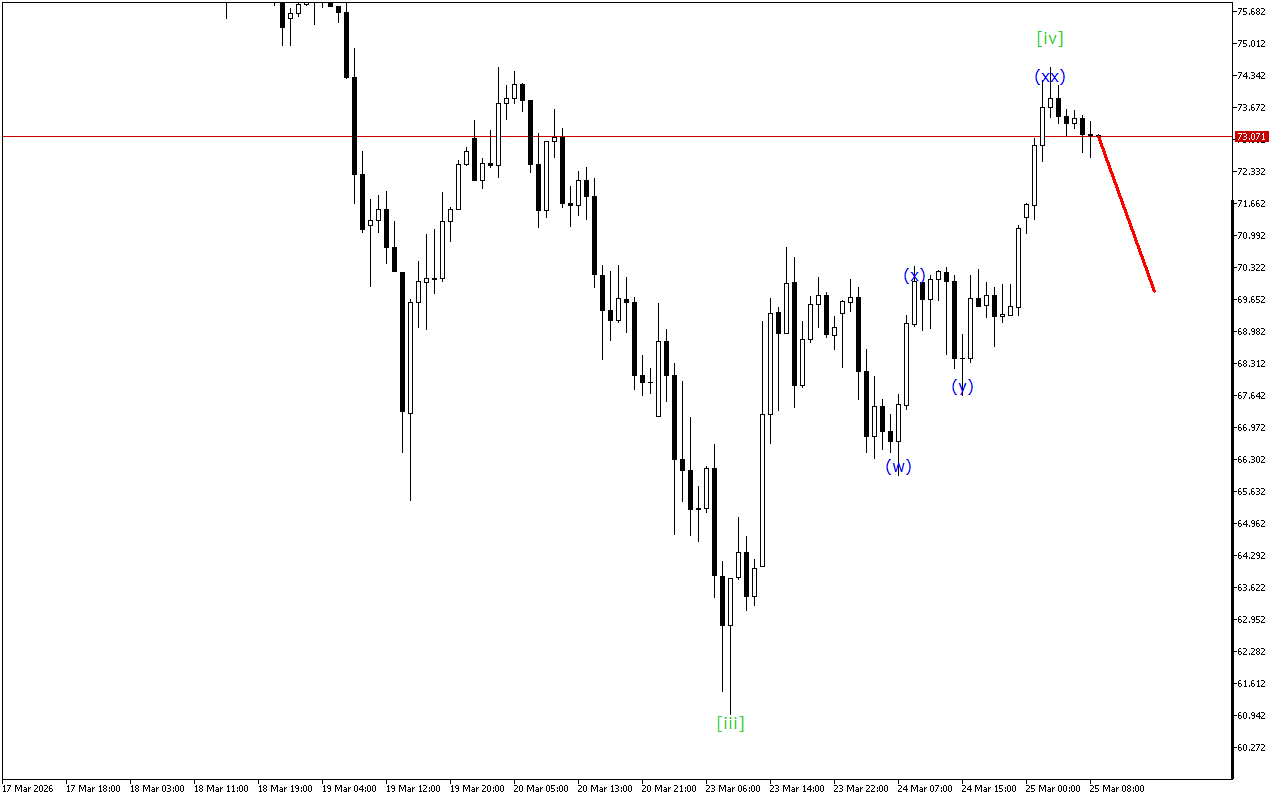
The higher-degree wave structure indicates a corrective movement in the form of an ABC zigzag. The final wave [c] of this structure is currently observed. Although the wave [c] has not been formed fully yet, we can expect its completion in the near future.
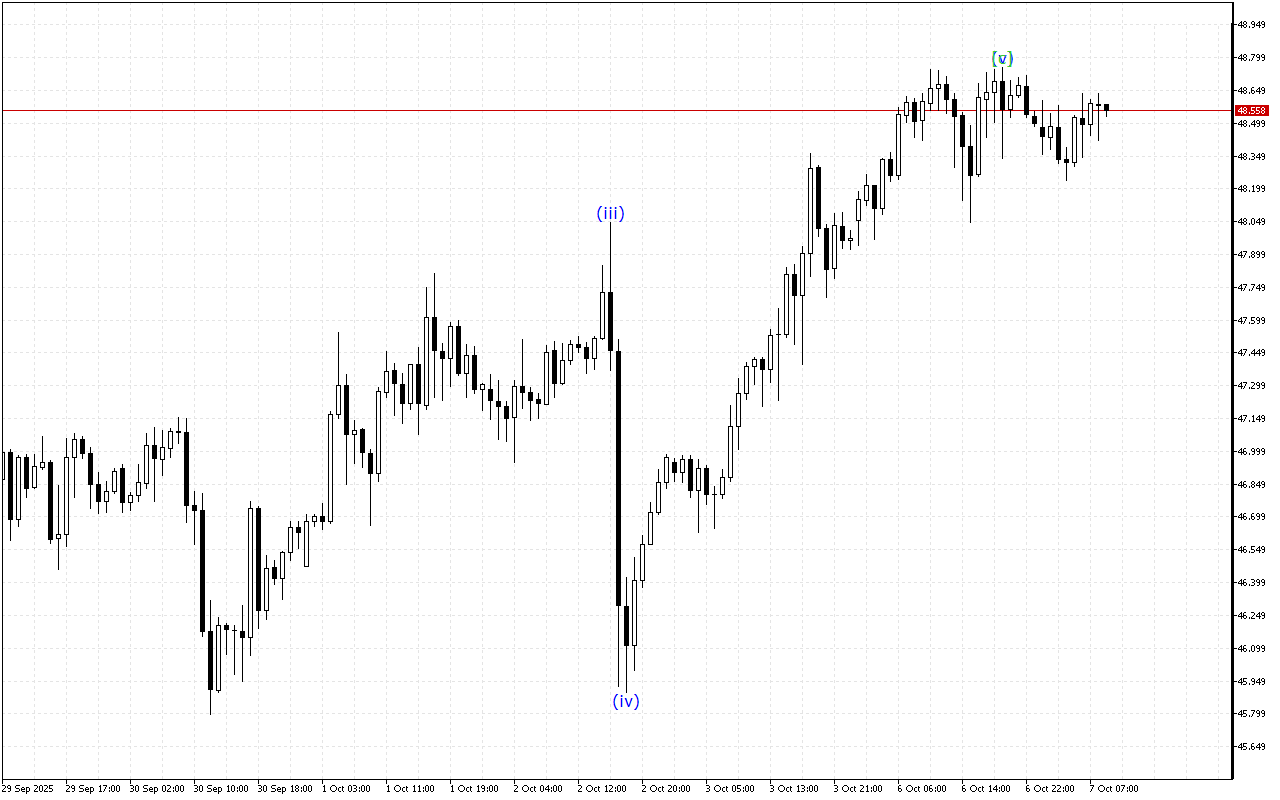
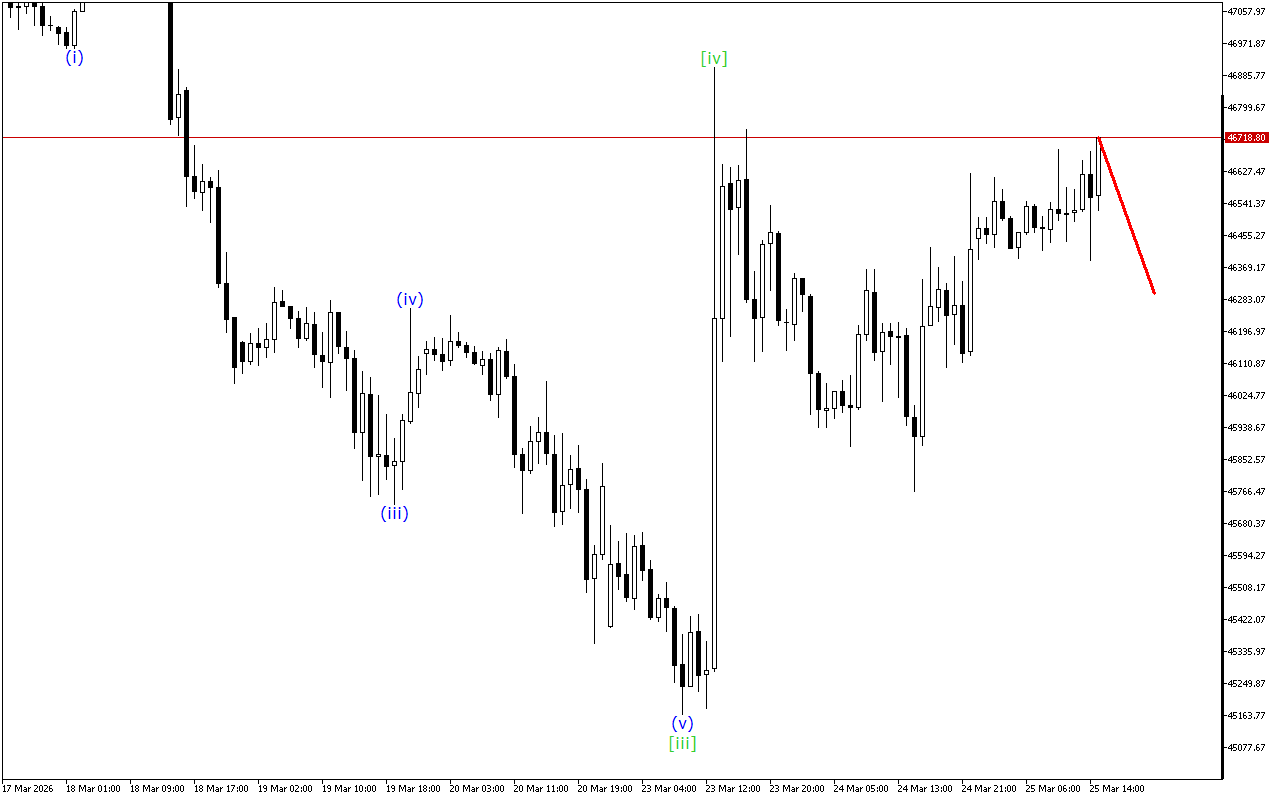
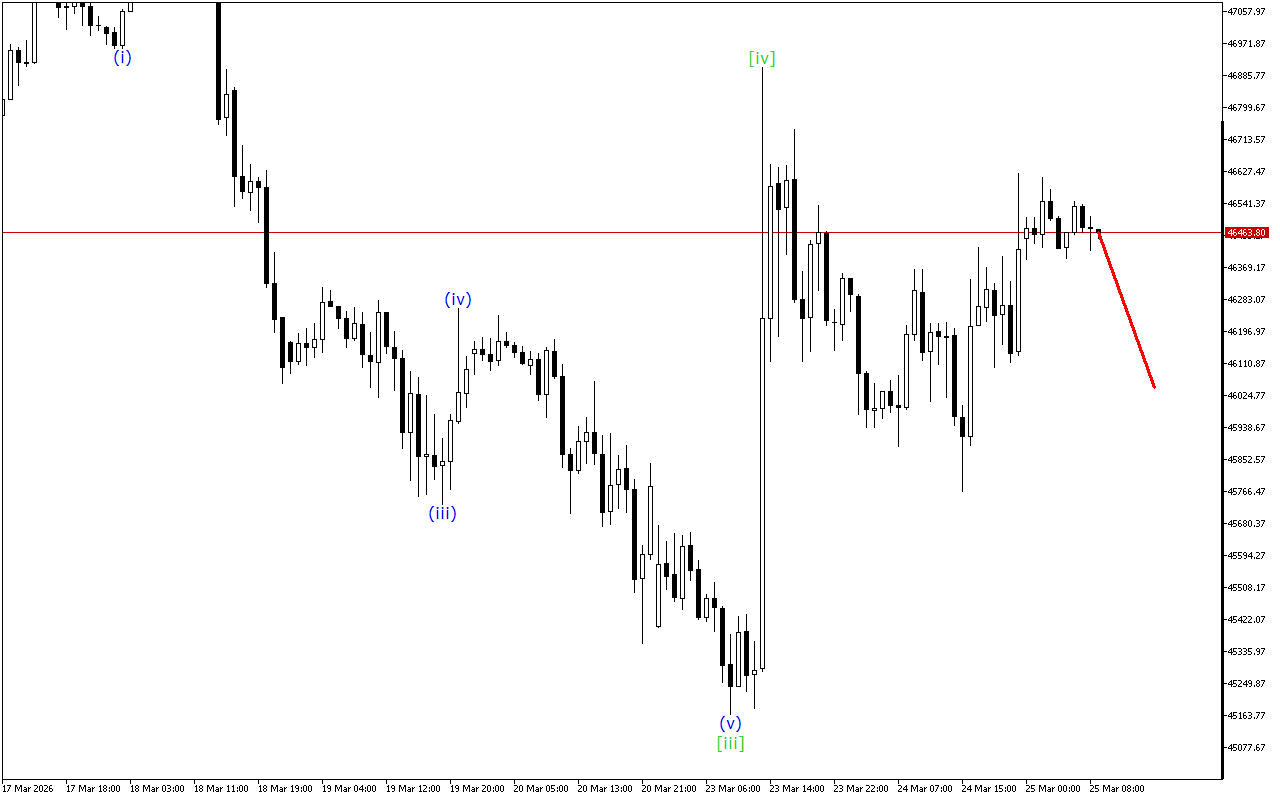
An upward impulse develops on a lower-degree wave structure. Now the price is moving within the final wave (v). Thus, the local trend remains upward.
To summarize, it is worth noting that the upward movement continues to develop on the chart on a higher time-frame. However, the wave analysis indicates the final stage of formation of this impulse.
In this situation, long positions are prioritized.