

The XAGUSD chart shows the continuation of mixed trading dynamics, reflecting the general uncertainty on the market.
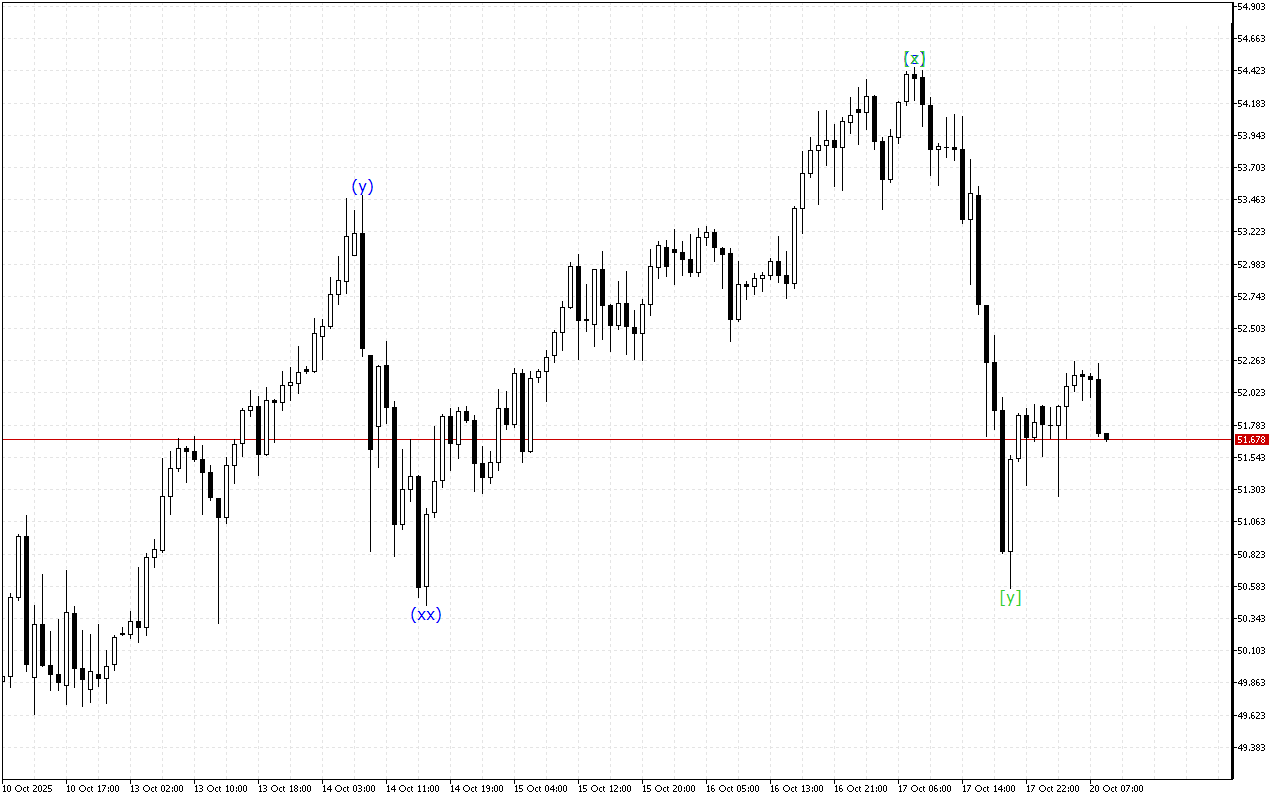
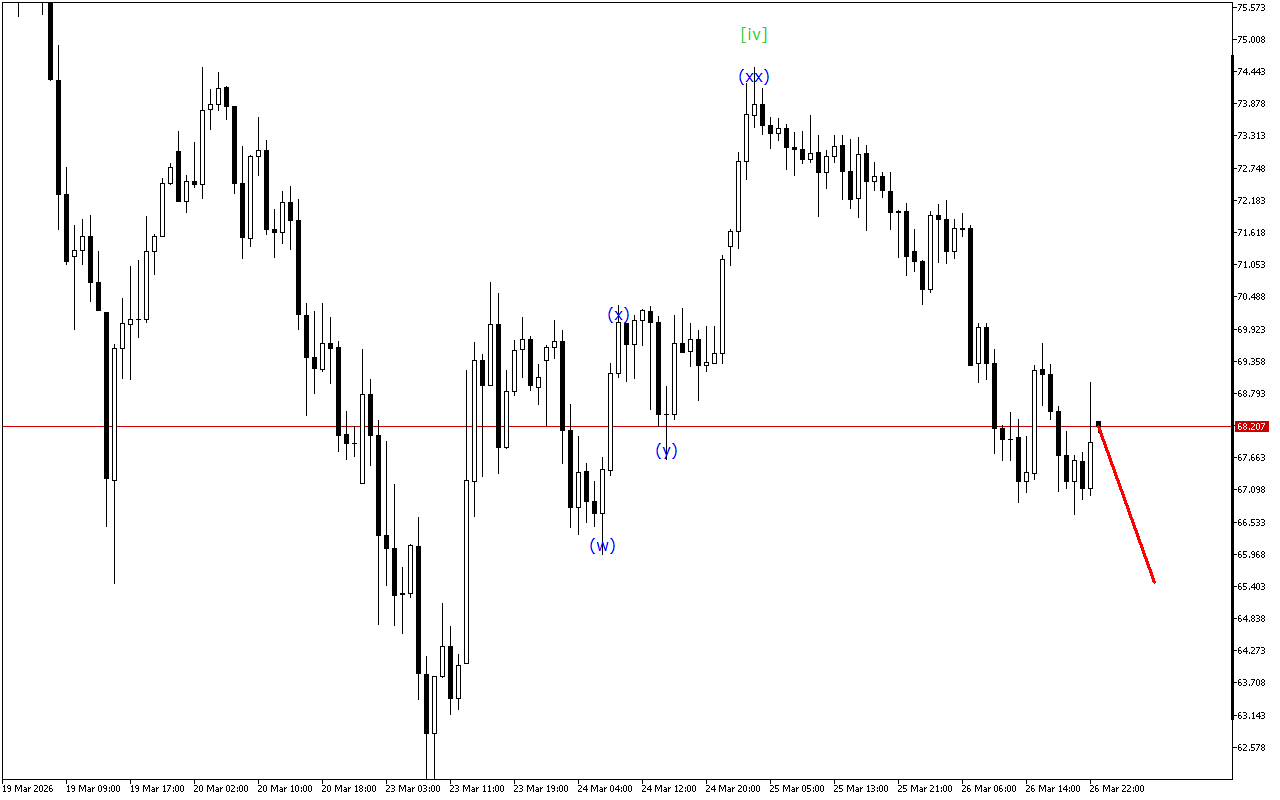
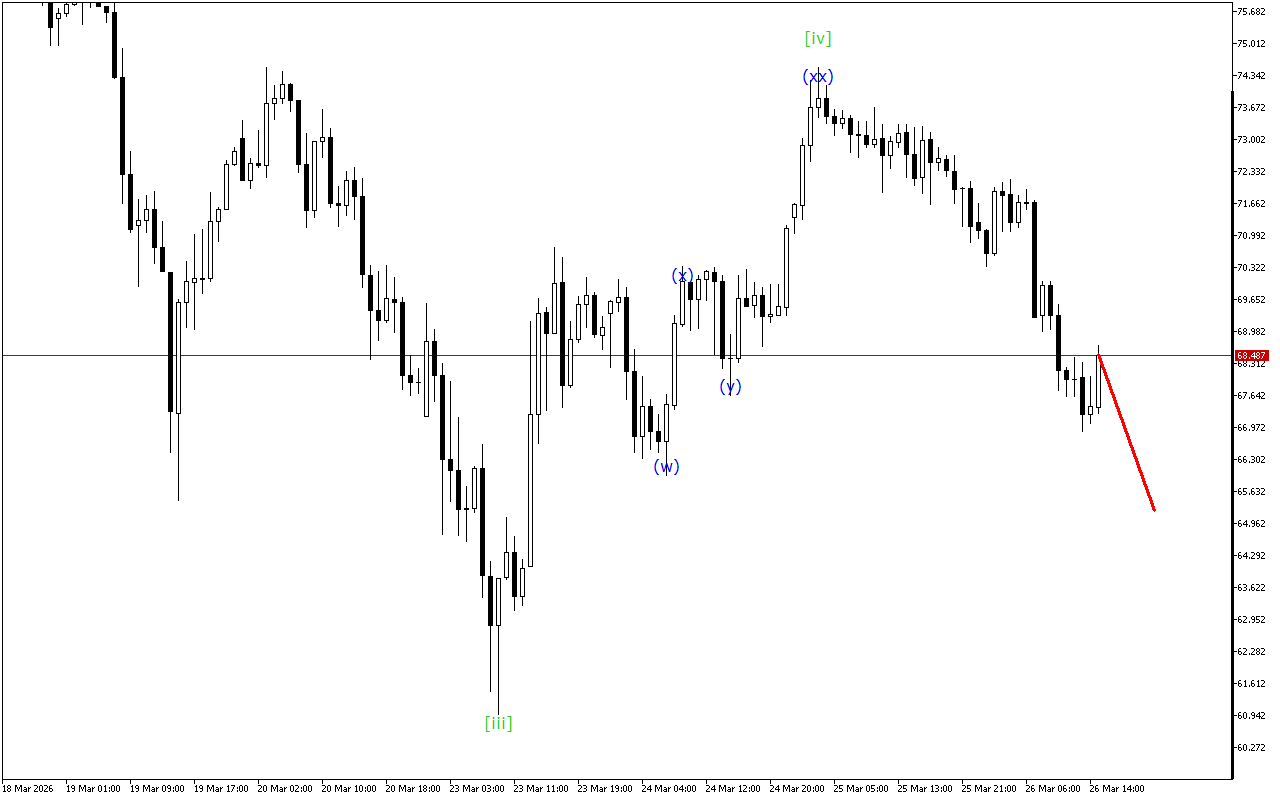
An analysis of the higher wave structure shows the formation of a WXY double three, with the development of the final wave [y]. After this, the development of a more directional price movement or the formation of a more complex five-wave structure can be expected.
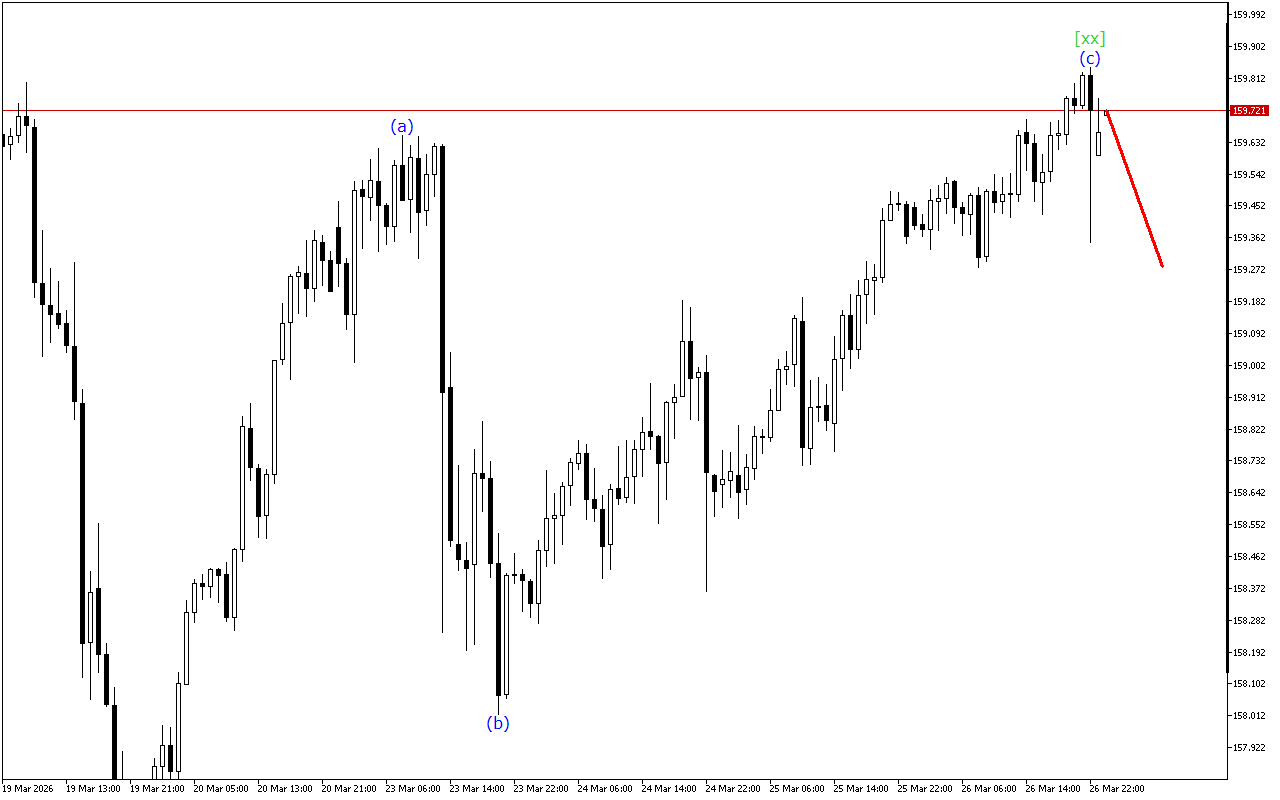
Within a lower-degree wave structure, the development of a triple three is noted. The formation of the wave (z) is being completed in this structure. Against this background, the completion of correction and the beginning of a more directional movement are expected.
Analysis shows that the market dynamics are characterized by mixed signals over a longer distance. In such conditions, it is worth waiting for the current wave to complete its formation.
In the current situation, it’s wise to hold off on making any trading decisions.