

The nature of the price movement on the XAGUSD chart remains mixed. The tool predominantly maintains the sideways direction.
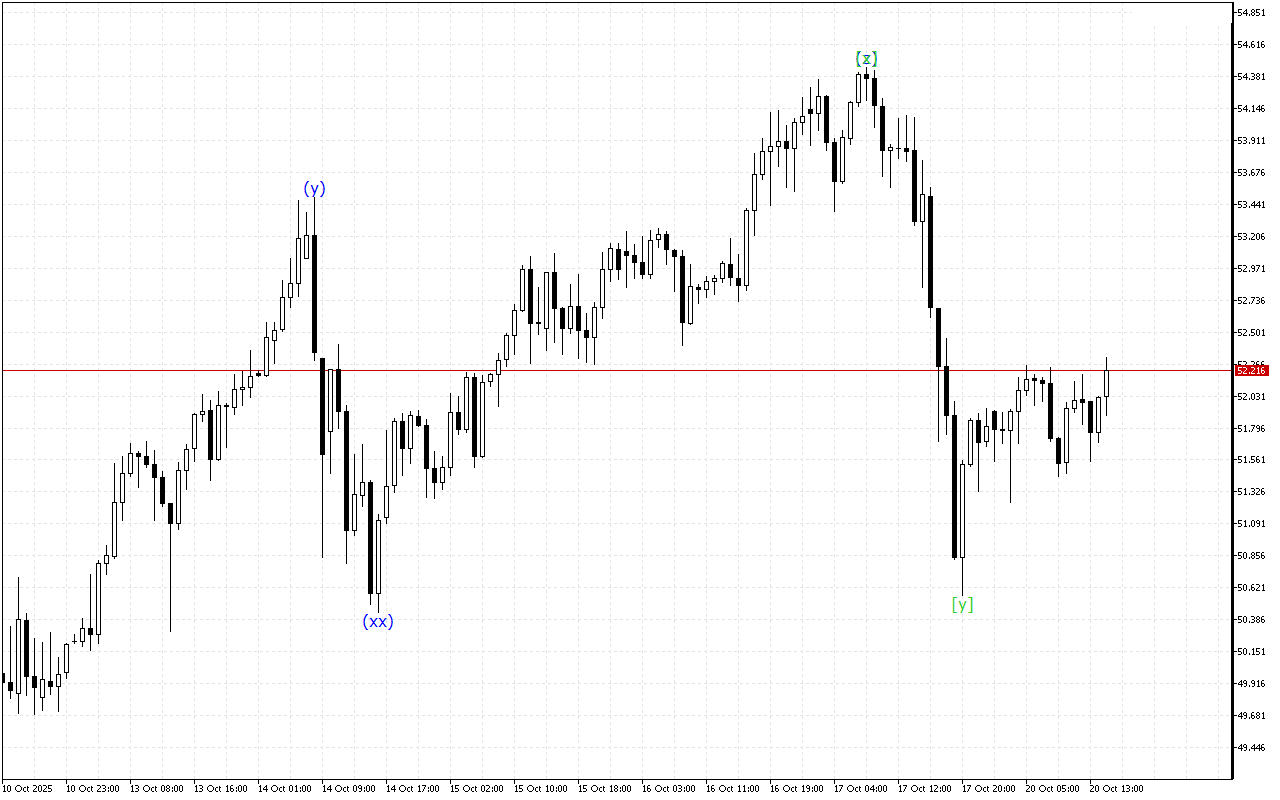
The current wave structure is hinting at the formation of a WXY double three where there is the final wave [y].
At a lower-degree wave structure, the formation of a triple three is noted. Now the price is in the wave (z), which completes this formation. This wave is expected to end in the near future. After that the current price trend may change.
To summarize, it can be noted that the market shows mixed dynamics over a longer period. In this situation, it is worth waiting for the current wave to complete its formation.
In the current environment, it’s advisable to avoid making significant trading moves.