

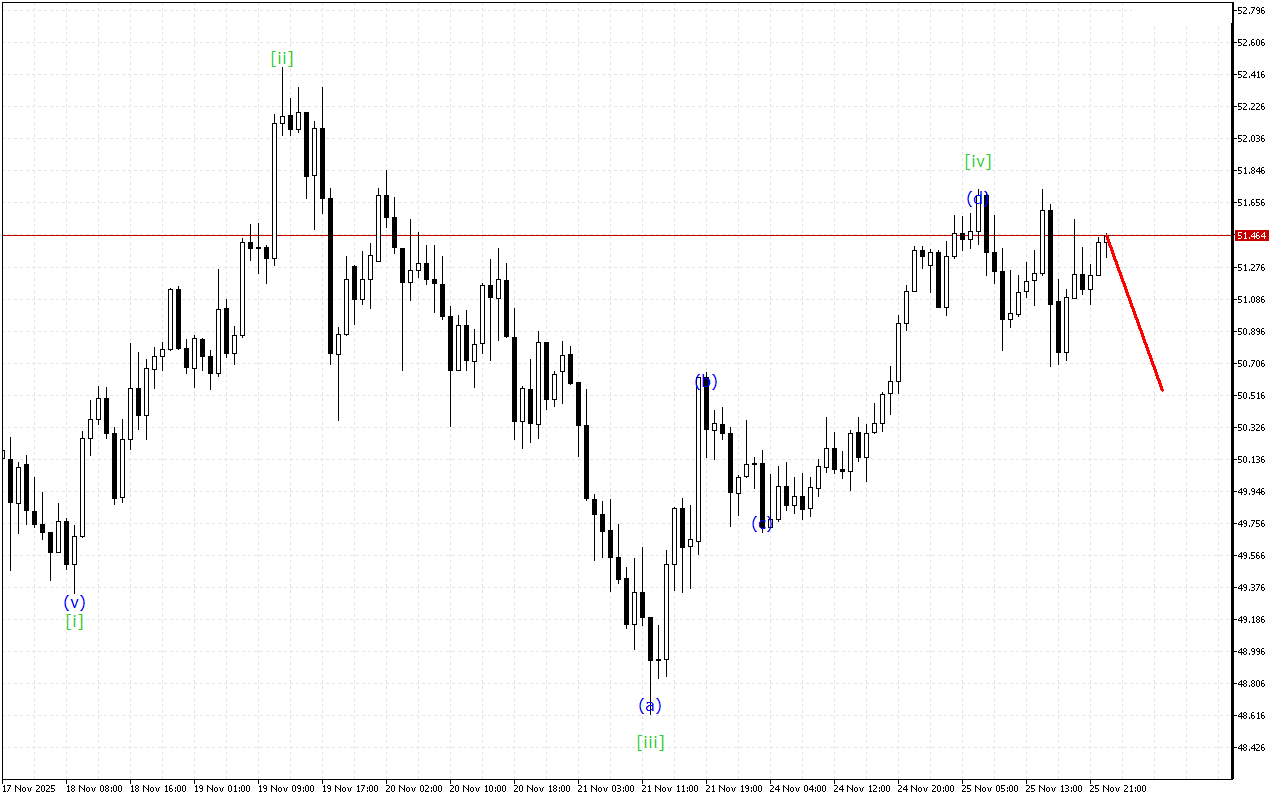
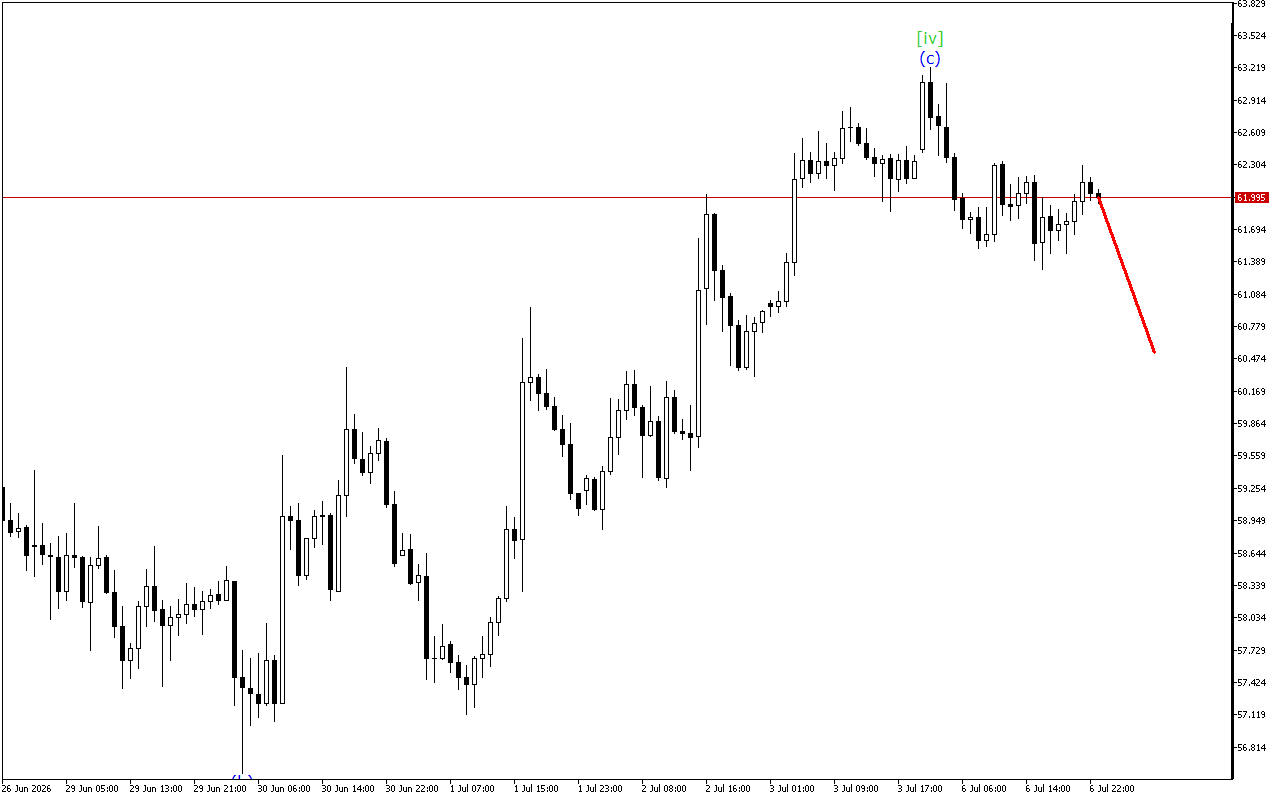
Although the market maintains an upward momentum prevalence, the XAGUSD chart shows signs of a possible end to this trend.
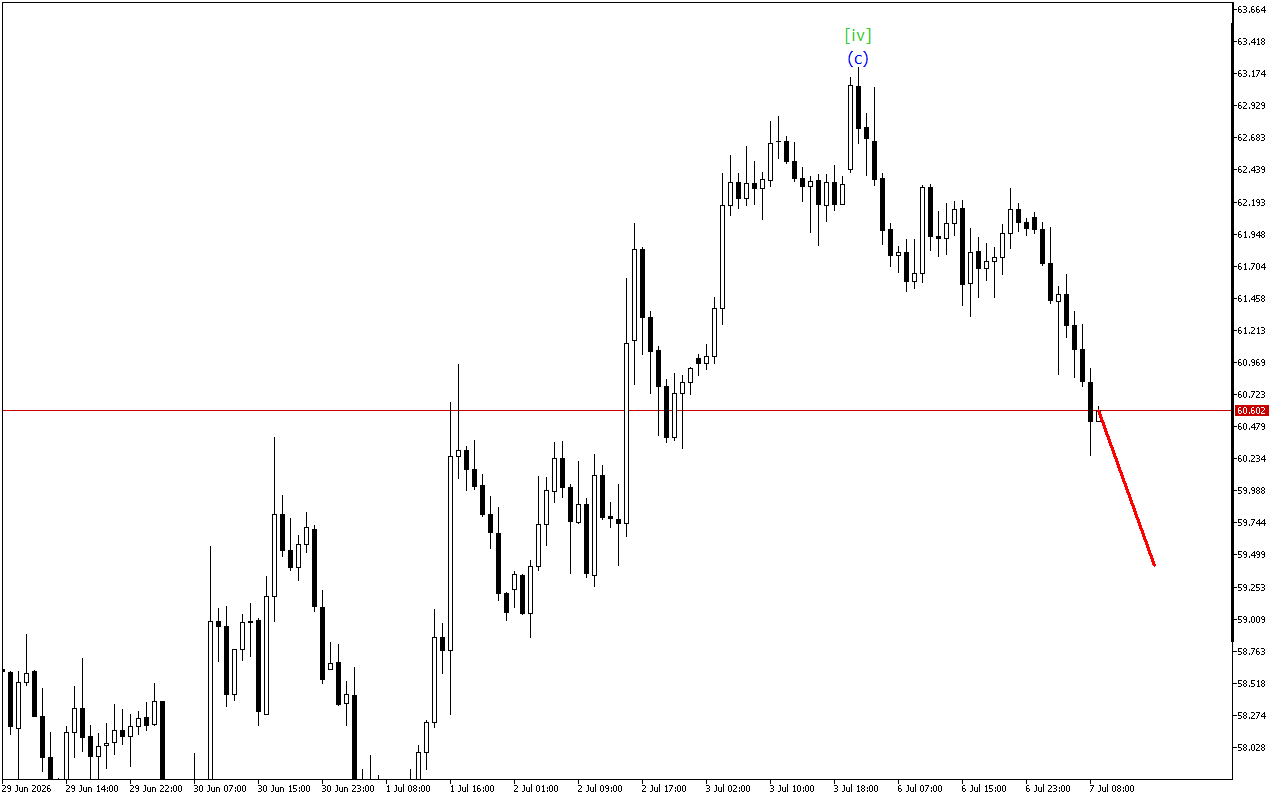
Within the higher time interval, the formation of a descending wedge can be seen. In this wave model, the wave [iv] is completed. After its completion a downward wave [v] should be expected.
According to a lower-degree wave structure, XAGUSD is now moving within the ABC zigzag. In this case, the price is likely completing the formation of the wave (c).
Despite the positive dynamics of the market movement, the possibility of resuming the downward movement after the completion of the current wave shouldn’t be excluded.
In this situation, it should be emphasized that short positions remain preferable.