

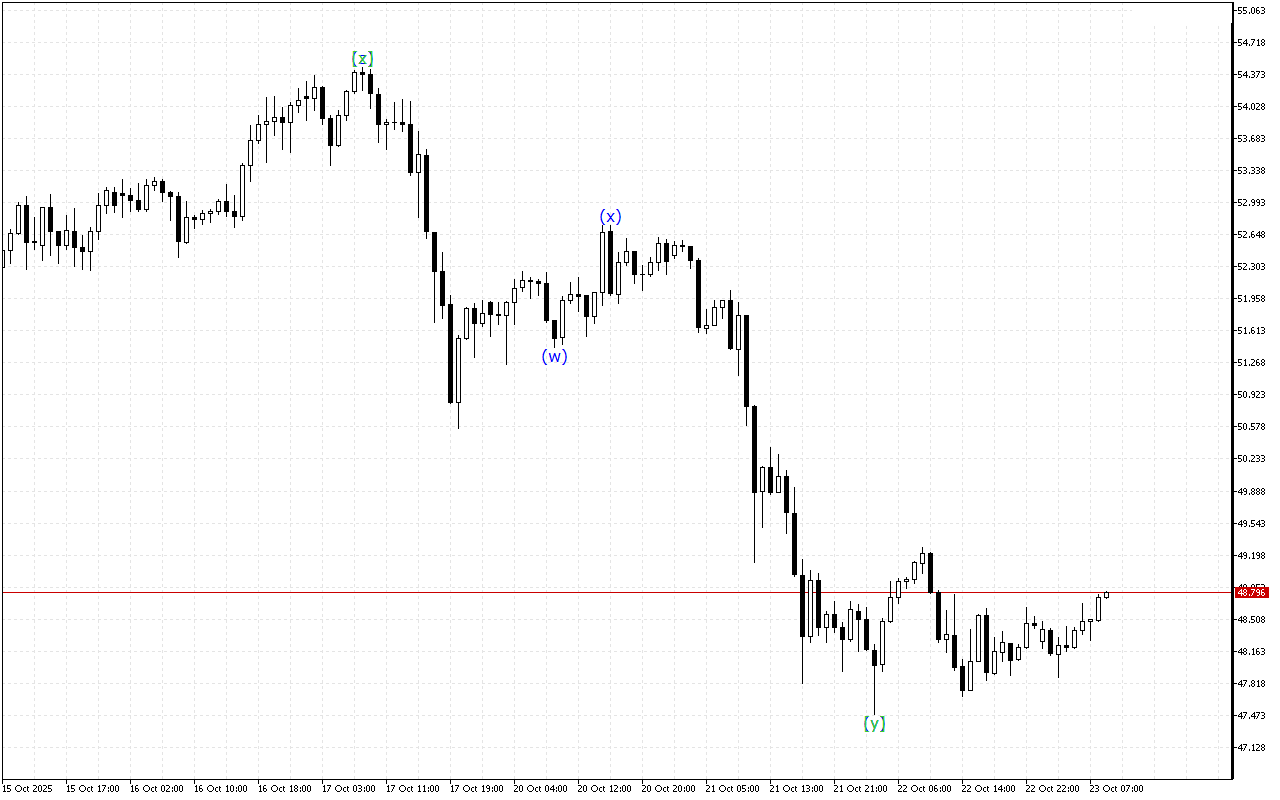
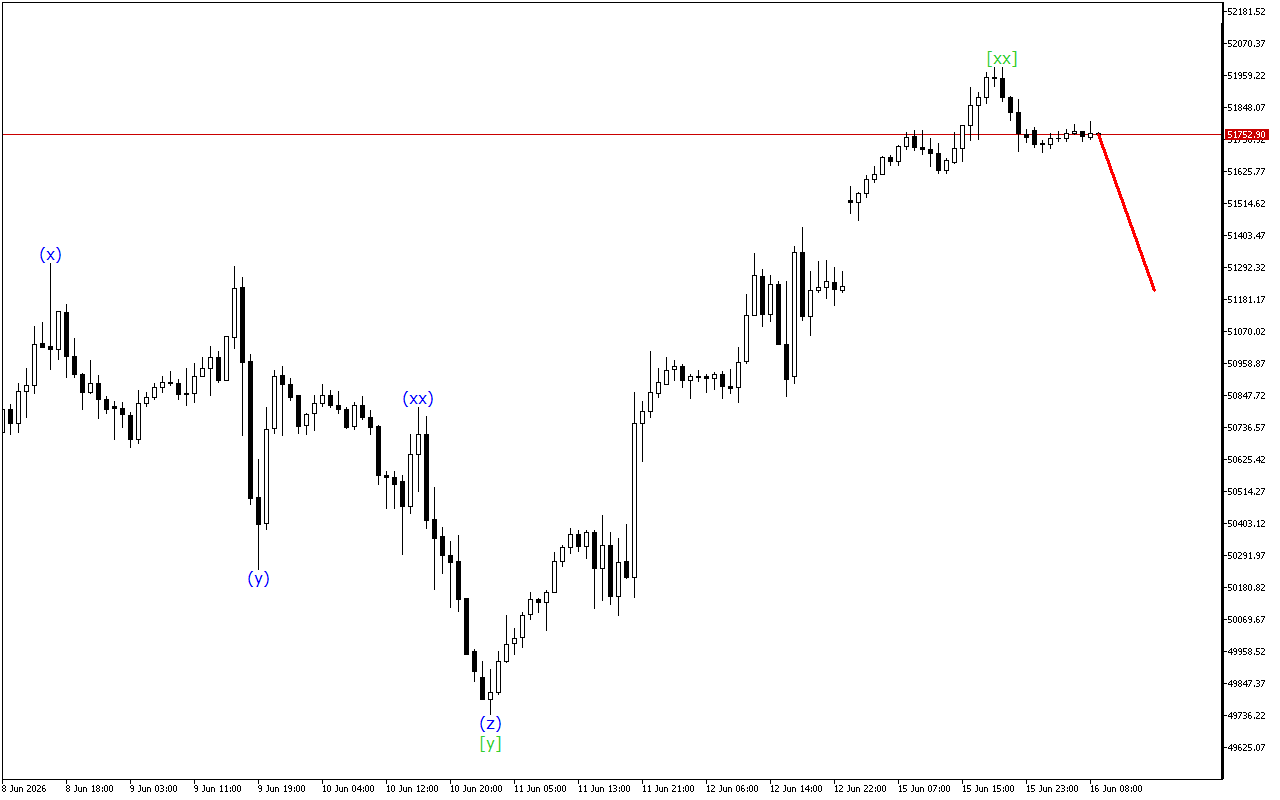
The nature of the price movement on the XAGUSD chart remains mixed. The tool predominantly maintains the sideways direction.
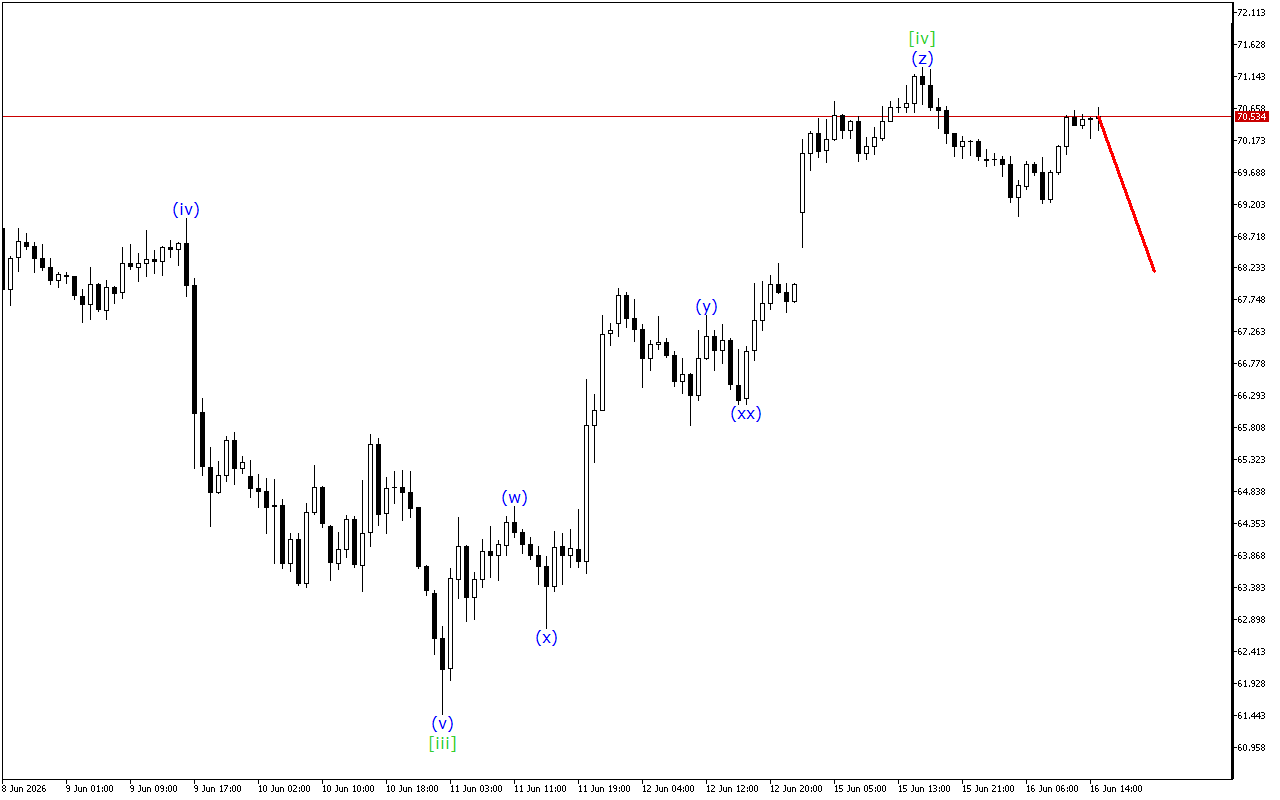
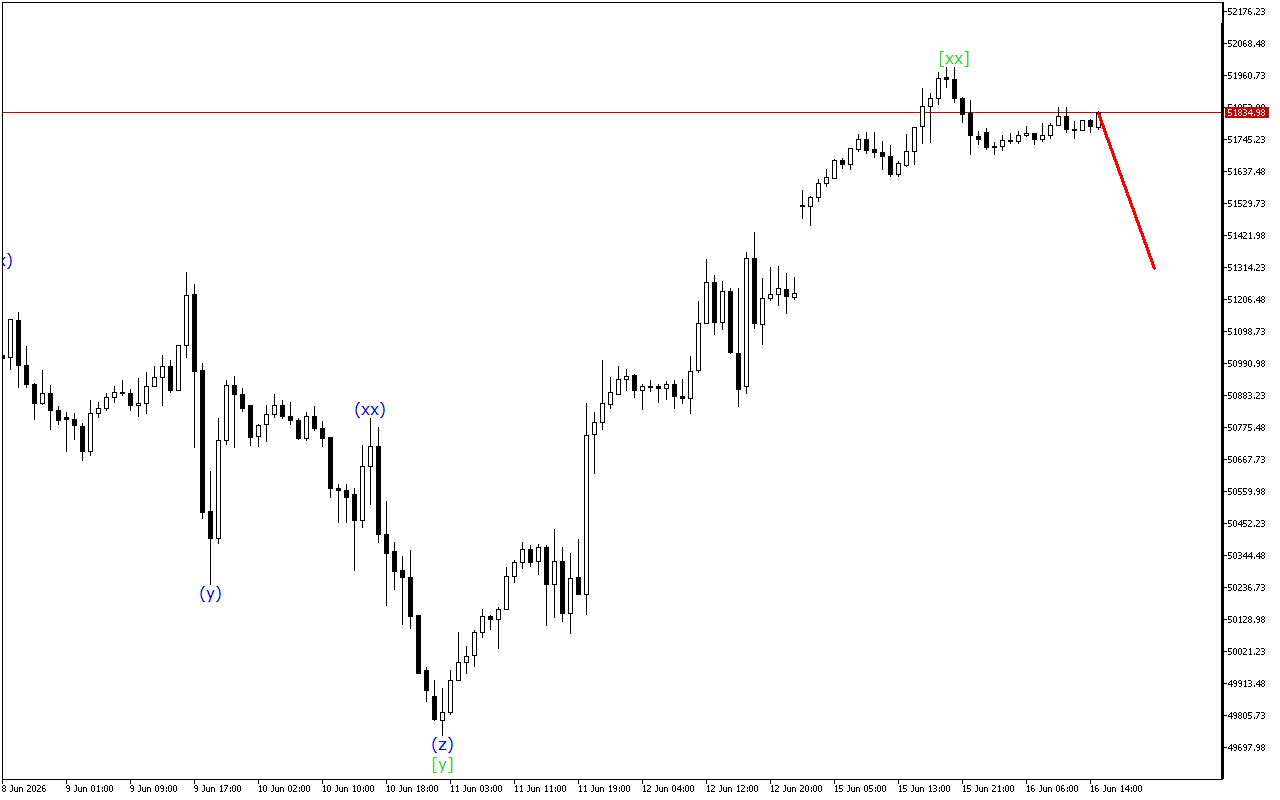
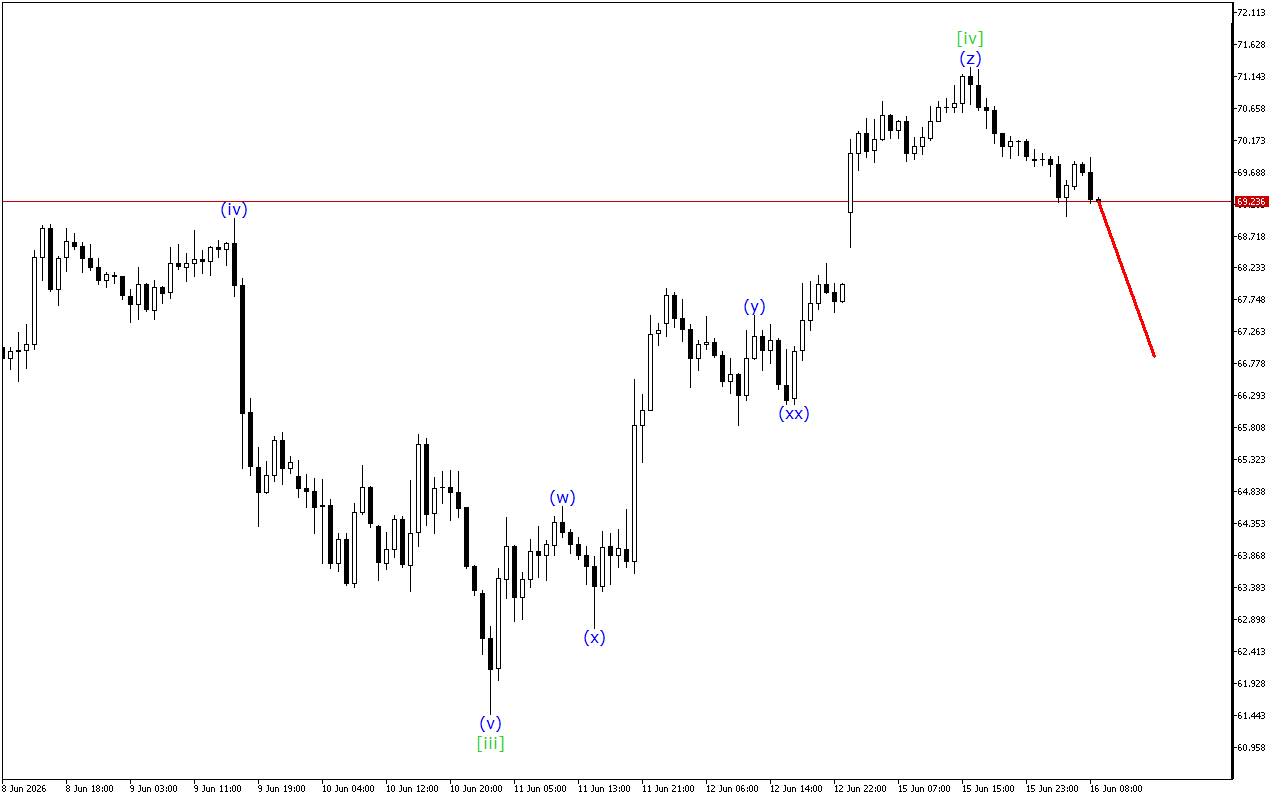
An analysis of the higher wave structure shows the formation of a WXY double three, with the development of the final wave [y]. After this, the development of a more directional price movement or the formation of a more complex five-wave structure can be expected.
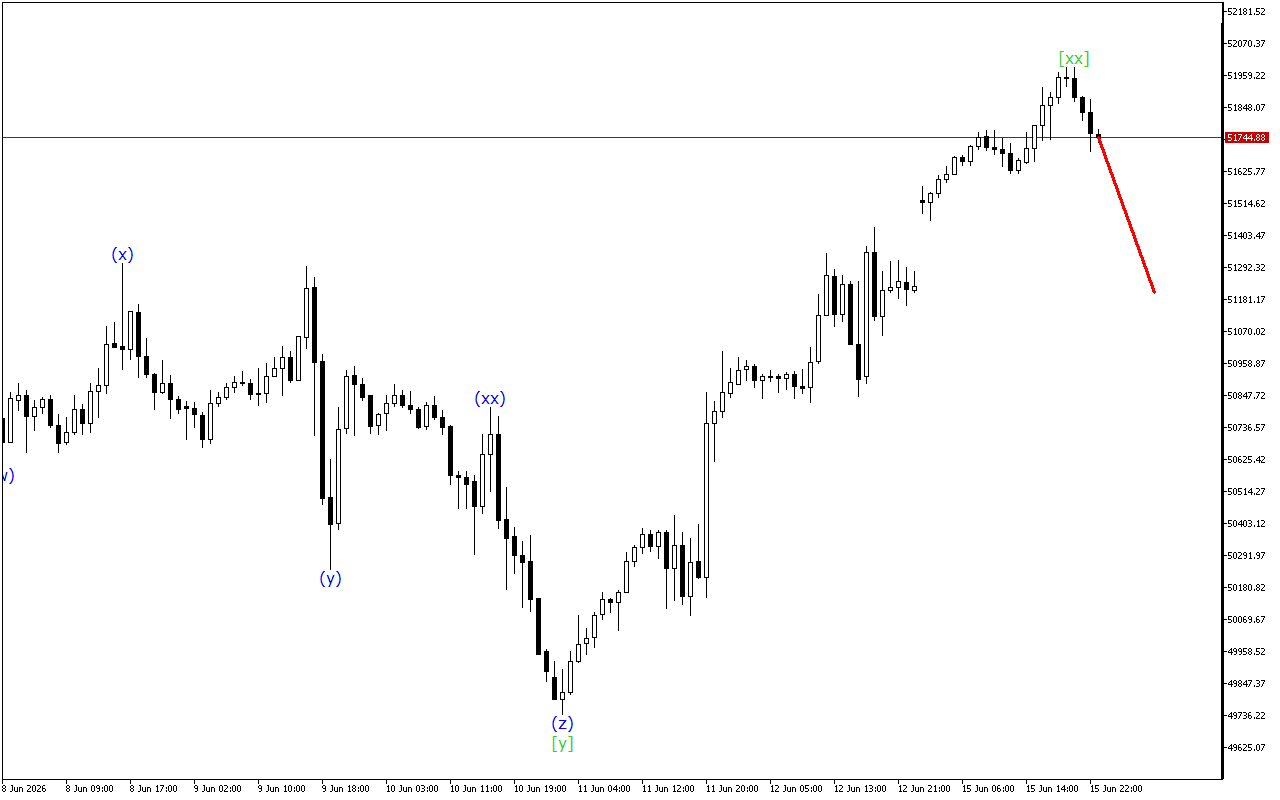
At a lower degree of the wave structure, the development of a triple three, where the formation of wave (z) has completed, is seen.
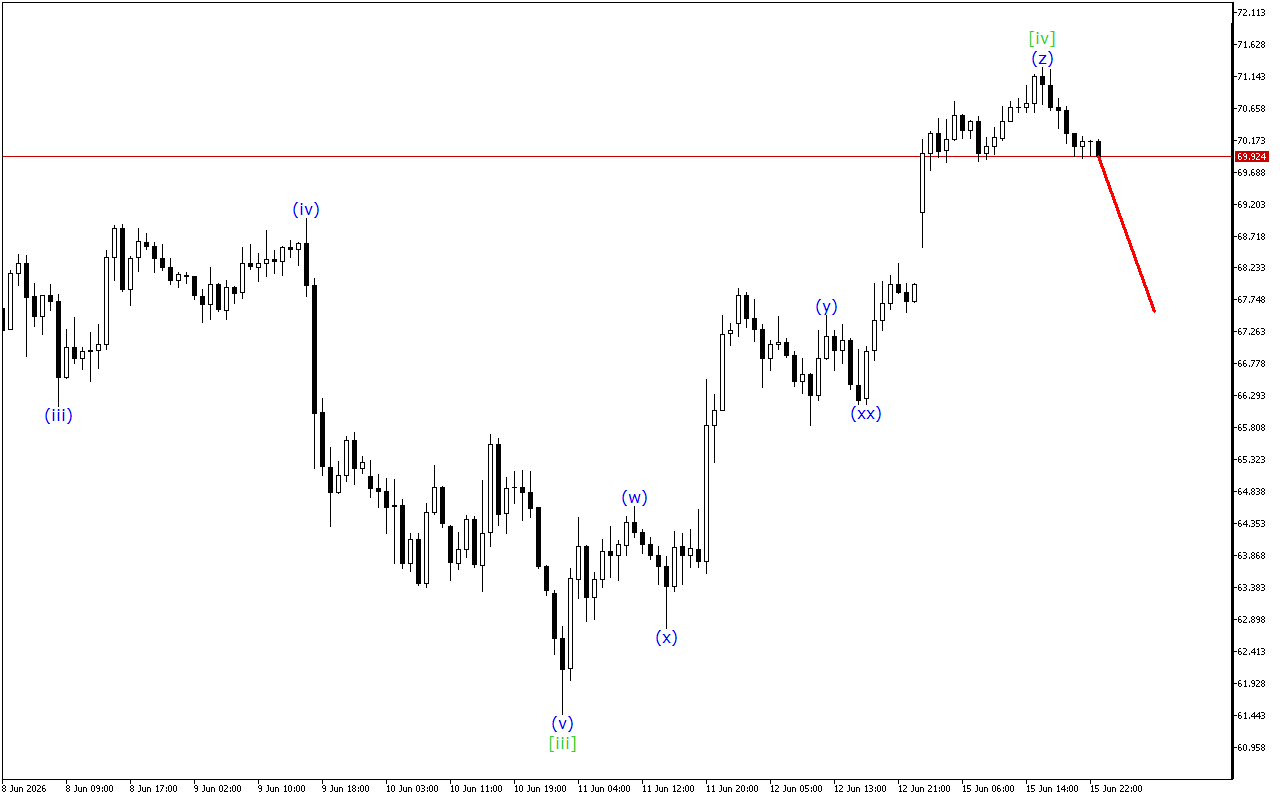
Analysis shows that the market dynamics are characterized by mixed signals over a longer distance. In such conditions, it is worth waiting for the current wave to complete its formation.
In the current situation, it’s wise to hold off on making any trading decisions.