

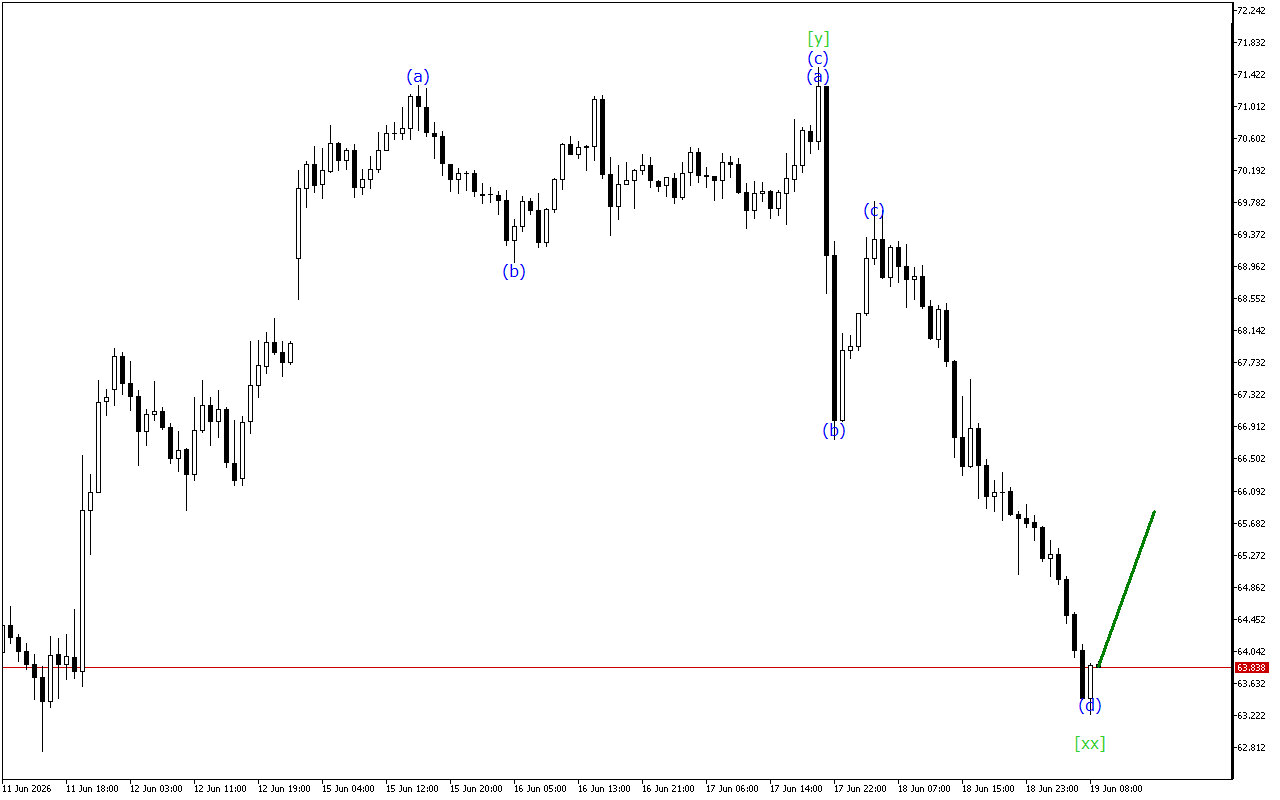
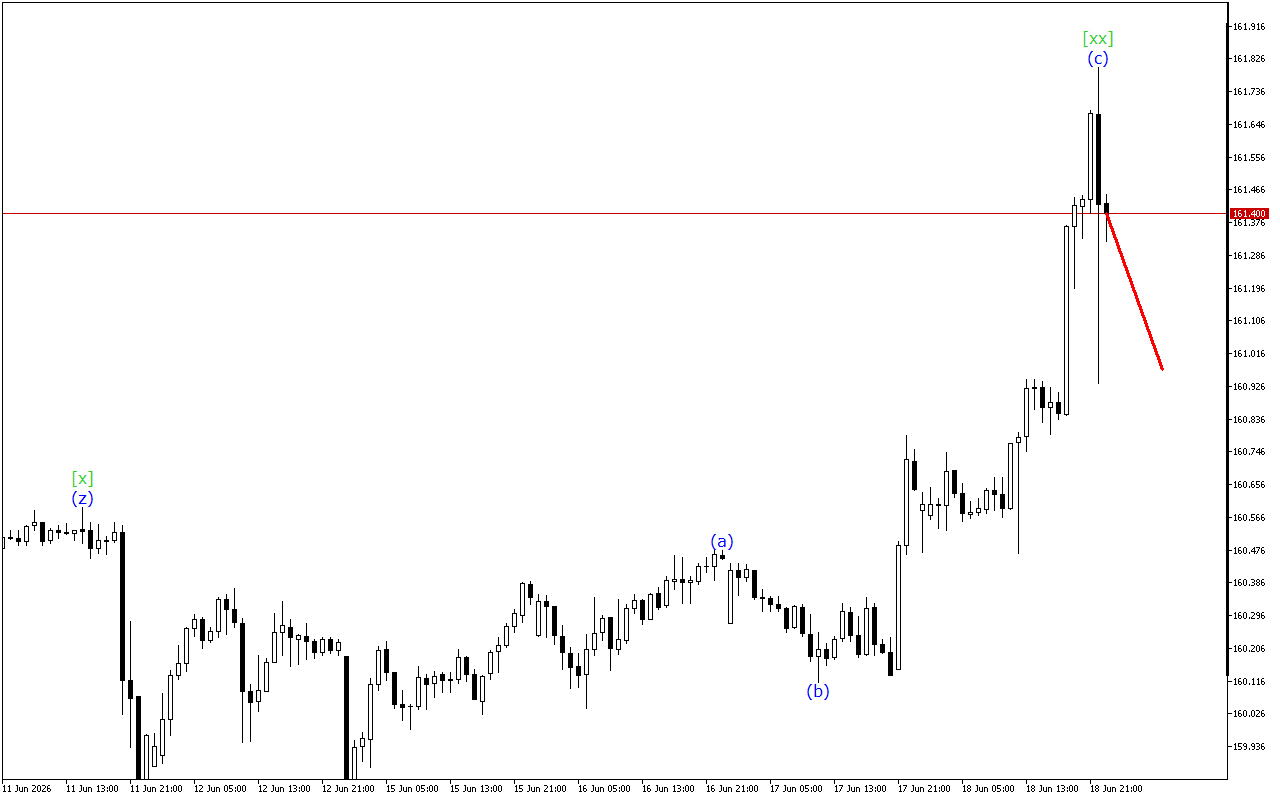
The USDJPY chart shows signals for the end of the upward movement phase.
There is the development of a triple three wave structure on a higher time-frame. Currently, the wave [xx] has been formed. After this the price should resume its downward movement.
At a lower-degree wave structure, the formation of a triple three is noted. Now the price is in the wave (z), which completes this formation. This wave is expected to end in the near future. After that the current price trend may change.
Despite the positive dynamics of the market movement, the possibility of resuming the downward movement after the completion of the current wave shouldn’t be excluded.
In this situation, it should be emphasized that short positions remain preferable.
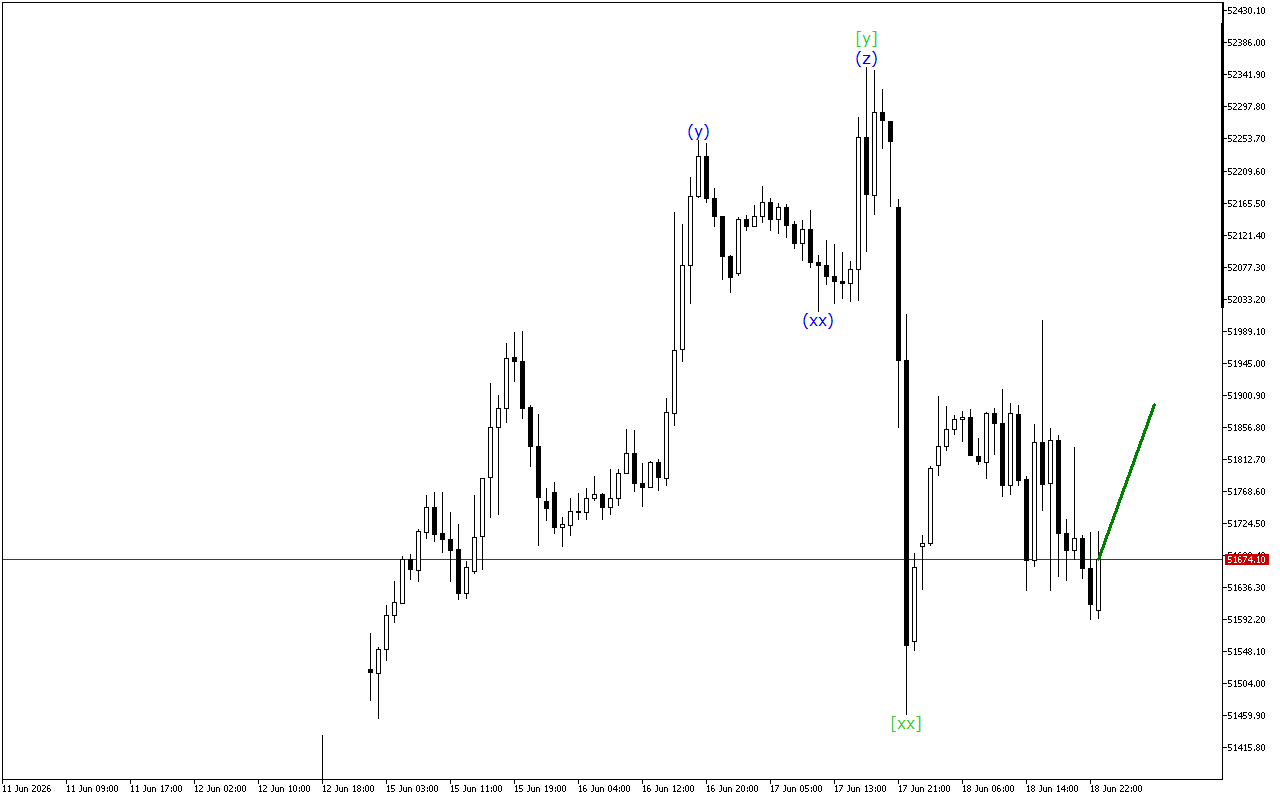
Alternative scenario
Long positions should be looked for after the breakout of the top of the current wave.
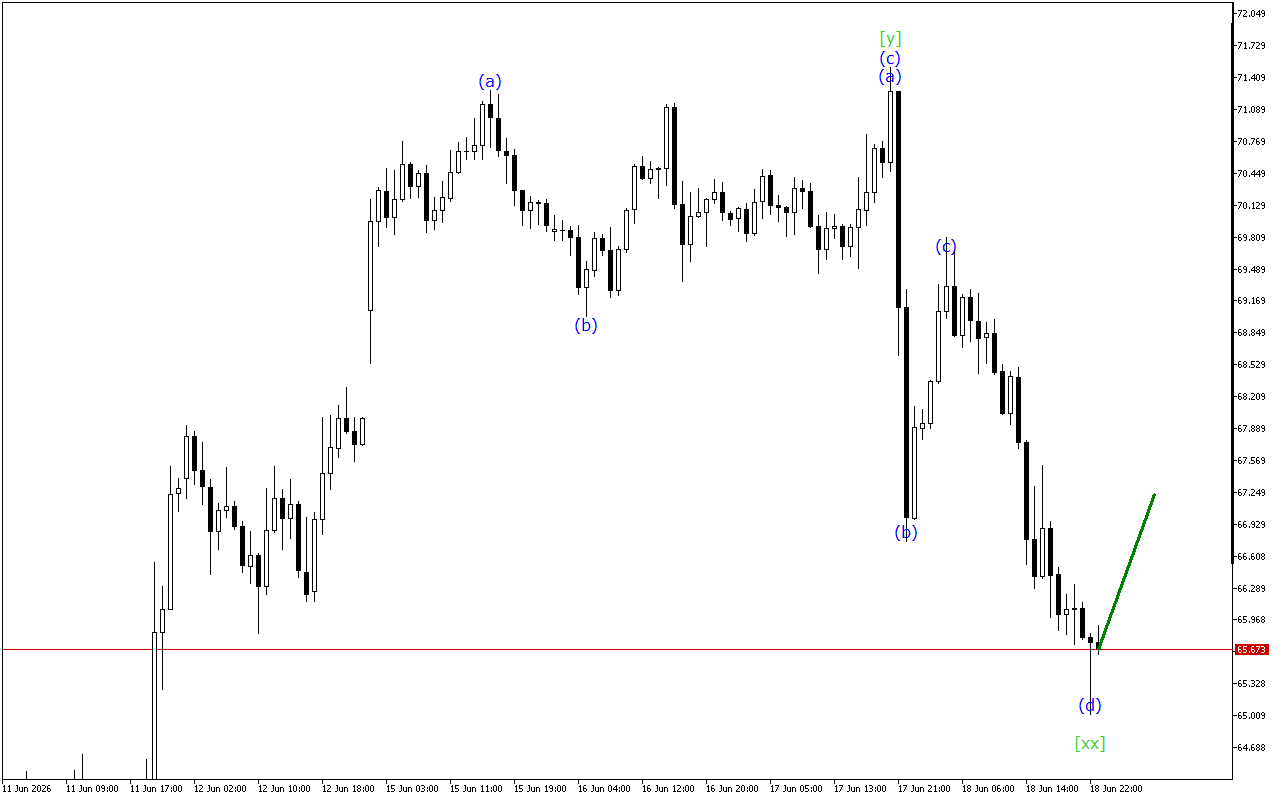
USDJPY H1: Wave Analysis for the American Session on 18.2.2026
Схожі Записи
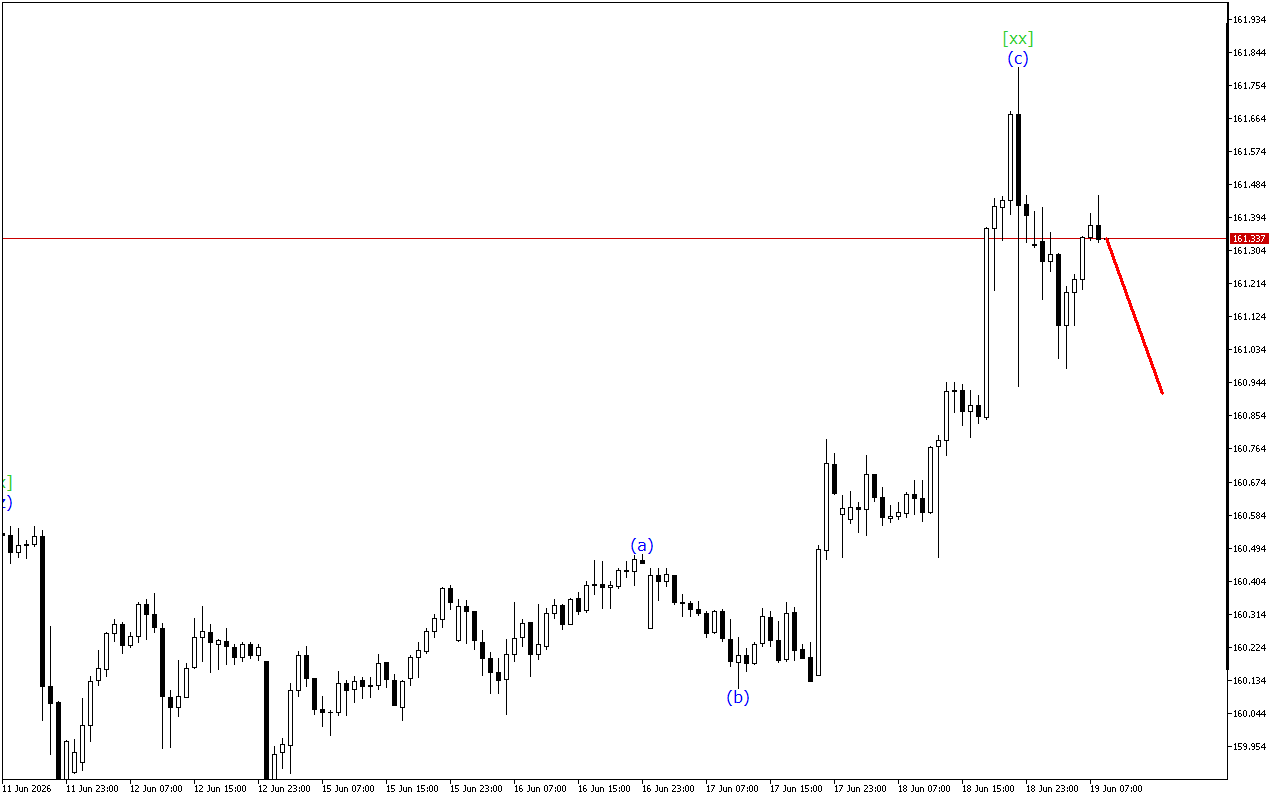
XAGUSD H1: Хвильовий аналіз для Європейської сесії 19.6.2026
Ринок все ще йде вниз, але графік показує ознаки того, що поточна тенденція скоро закінчиться.XAGUSD продовжує рухатися в структурі хвилі “Потрійної Трійки“. Зараз, мабуть, на графіку завершилося формування хвилі [xx]…
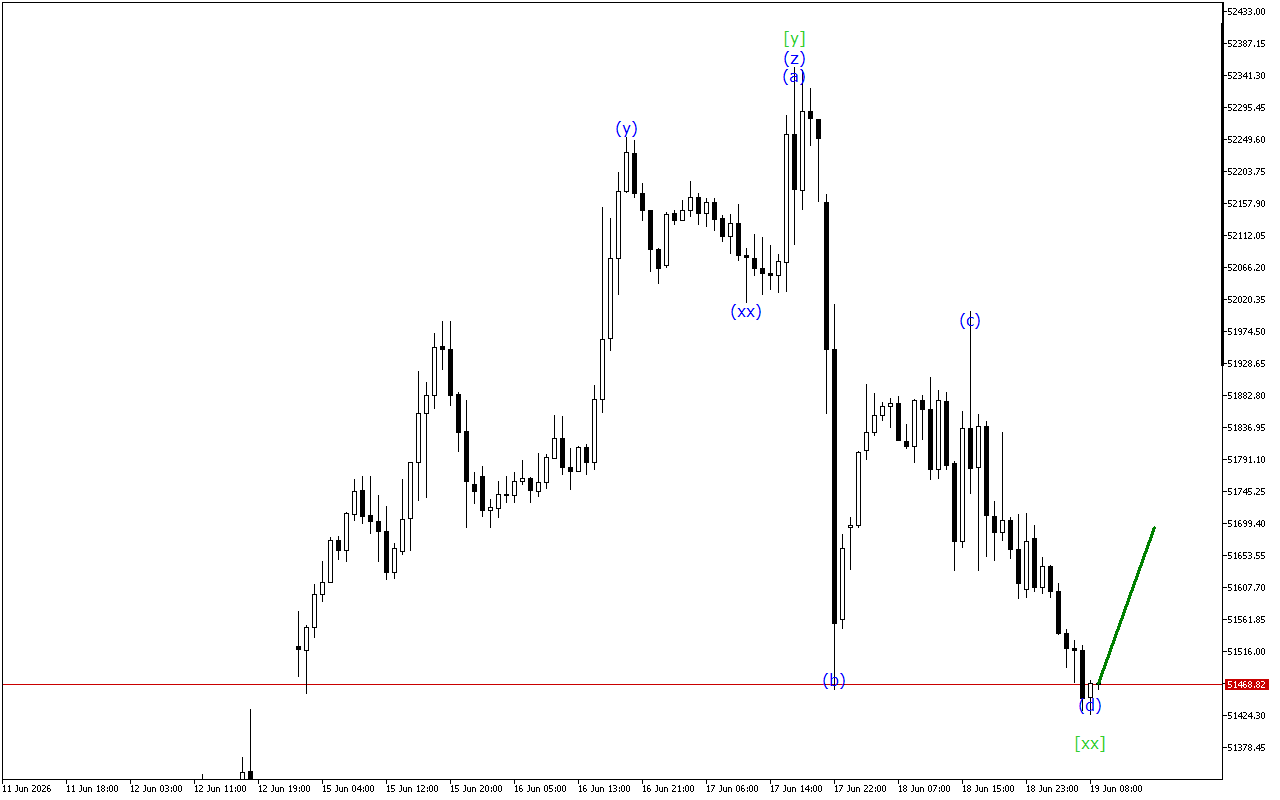
USDJPY H1: Хвильовий аналіз для Європейської сесії 19.6.2026
Графік USDJPY показує сигнали про закінчення висхідного імпульсу.Існує розвиток потрійної трихвильової структури на більш високому таймфрейме. Наразі сформована хвиля [xx]. Після цього ціна повинна відновити рух вниз.Відповідно до хвильової структури…