

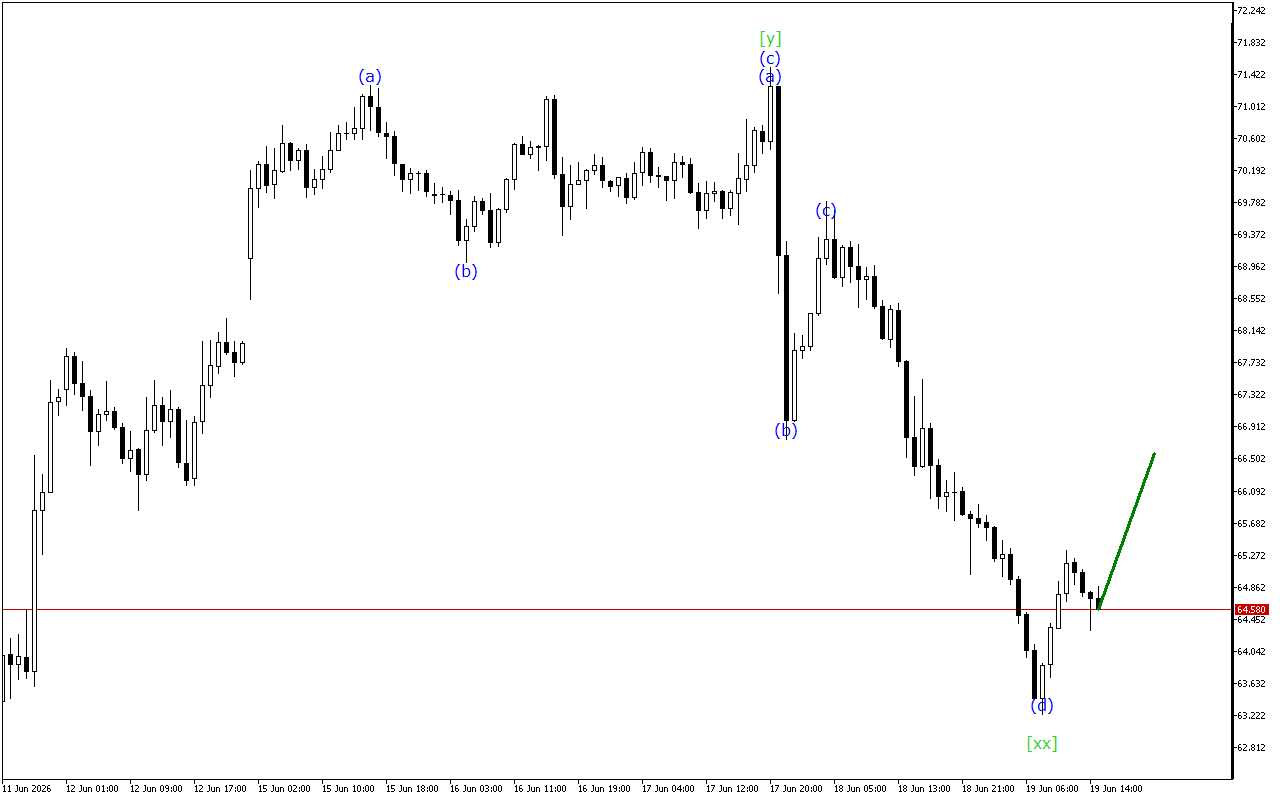
Despite the steady decline in price, the USDJPY chart is giving signals about a possible completion of the current bearish momentum.
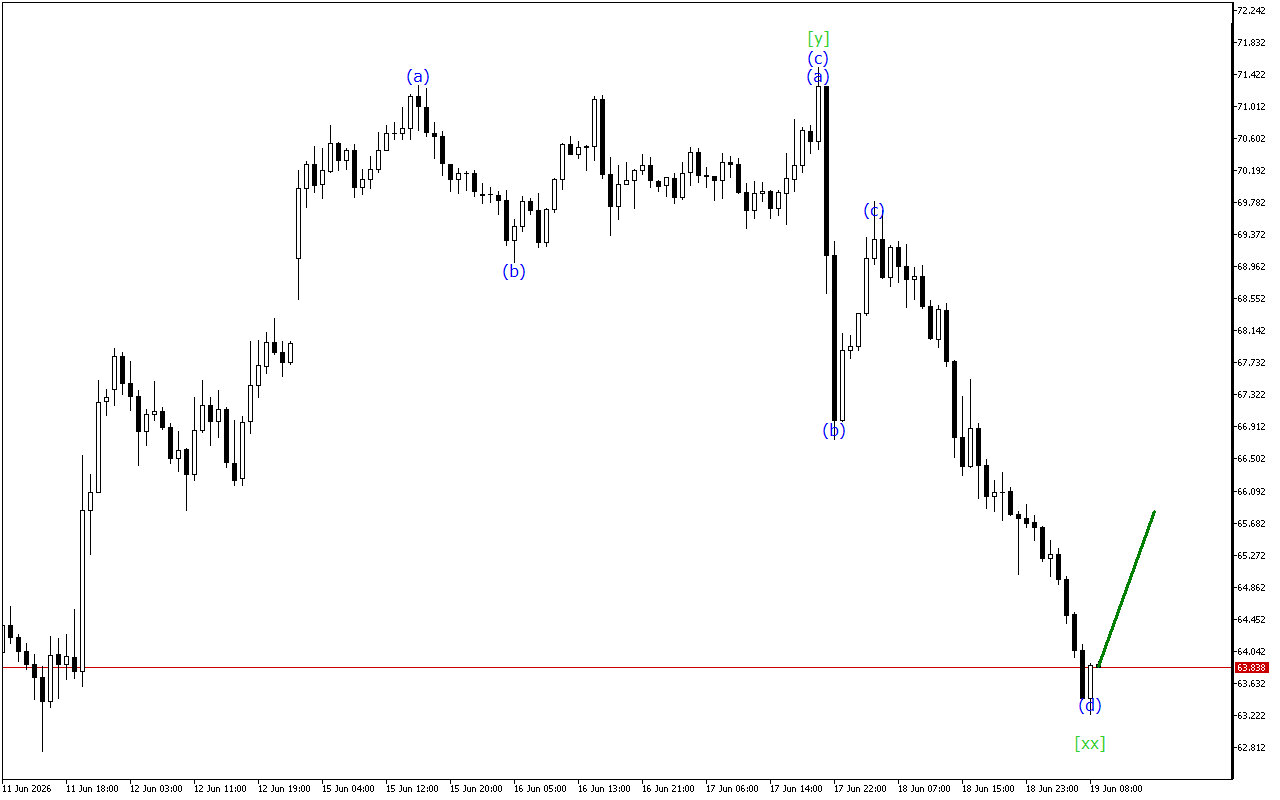
The medium-term movement vector of USDJPY indicates the formation of a Triple Three wave structure. Now the formation of the wave [xx] is completed and the beginning of an upward movement within the wave [z] is expected.
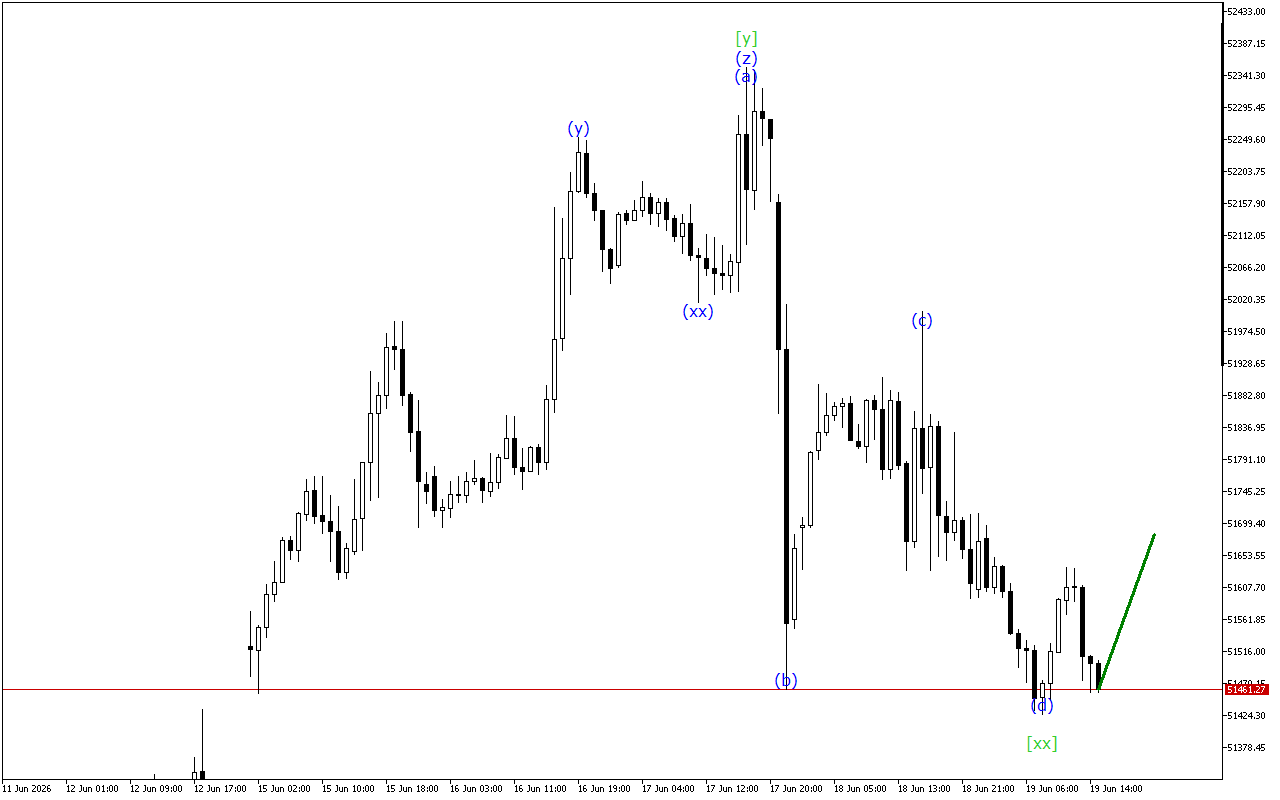
Waves of a lower time-frame form a triple three. The price is currently in the wave (z). When this wave is completed, a more directional price movement is expected.
To summarize, at the moment the USDJPY chart is maintaining a downward movement vector. However, the corrective wave is in the final stage of formation.
In this situation, long positions are prioritized.
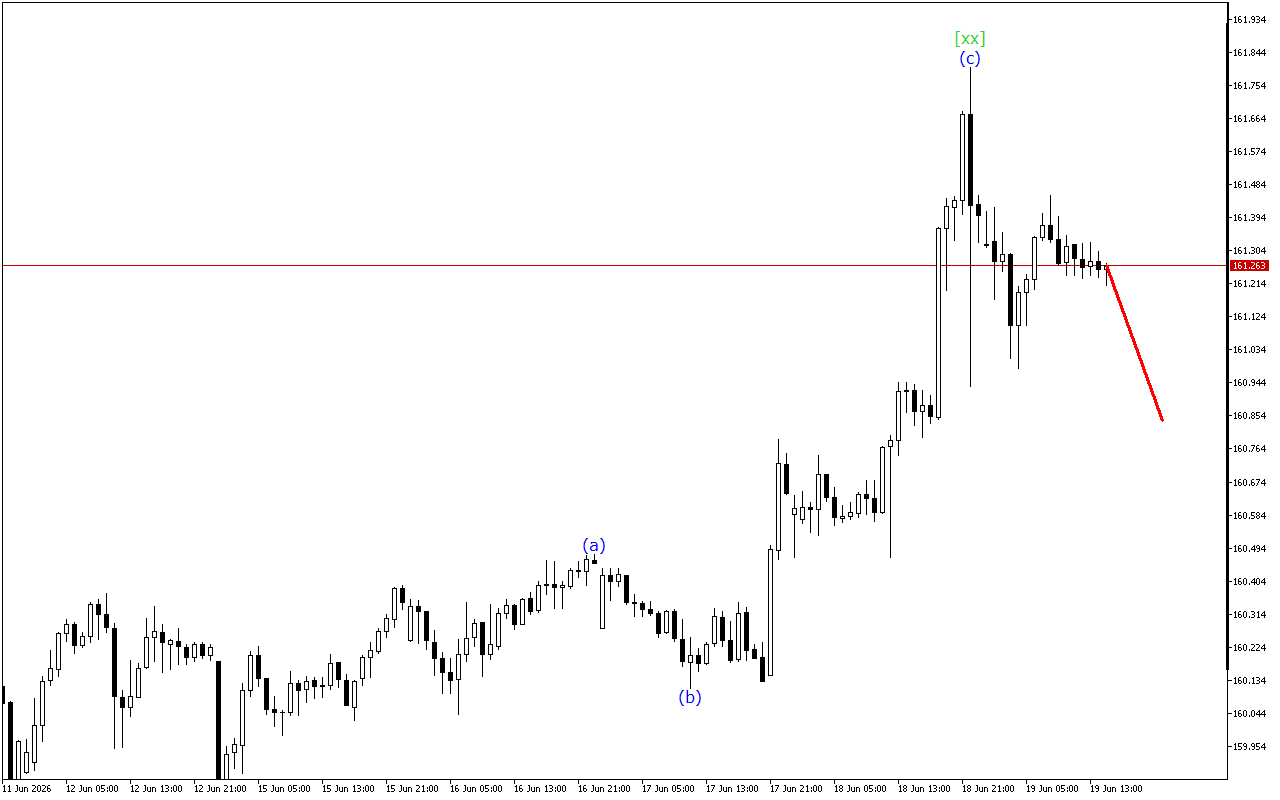
Alternative scenario
Short positions will be relevant after the breakout of the current wave start level
USDJPY H1: Wave Analysis for the American Session on 16.2.2026
Схожі Записи
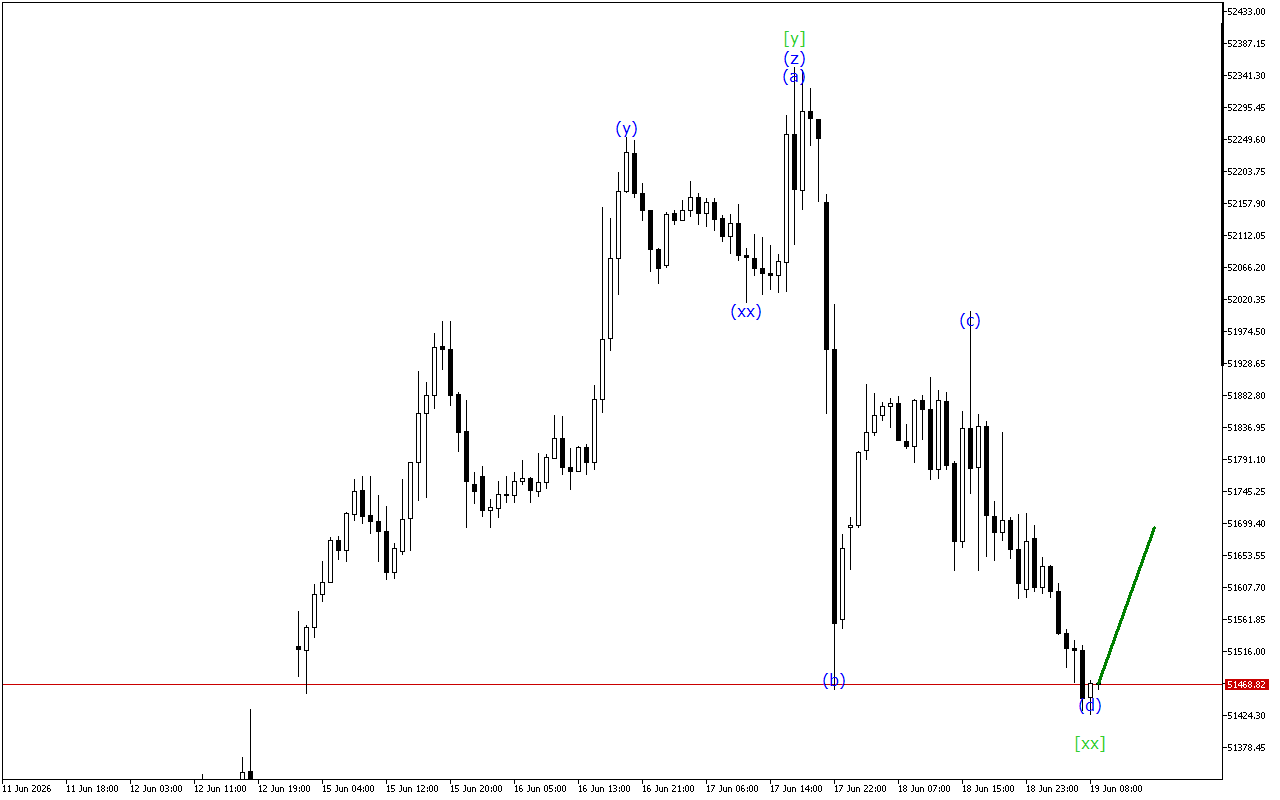
XAGUSD H1: Хвильовий аналіз для американської сесії 19.6.2026
Незважаючи на падіння, на графіку XAGUSD є сигнали, які вказують на можливу зміну напрямку в майбутньому.Середньостроковий вектор руху XAGUSD вказує на формування структури потрійних трьох хвиль. Зараз завершено формування хвилі…
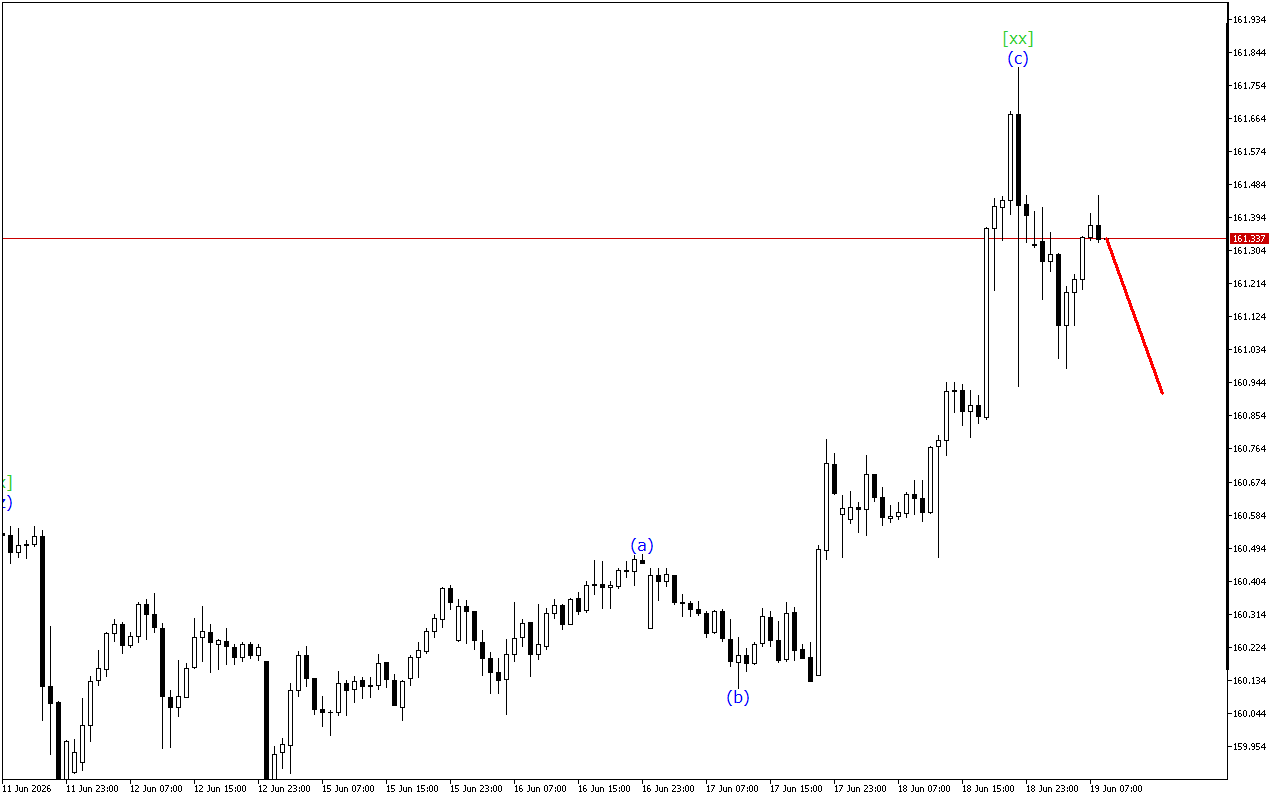
USDJPY H1: Хвильовий аналіз для американської сесії 19.6.2026
Графік USDJPY показує сигнали про закінчення висхідного імпульсу.Сучасна динаміка руху свідчить про формування потрійної трійки. На даний момент сформована хвиля [xx]. Після його формування очікується розвиток спадної хвилі [z].У контексті…