

Although the market continues to move higher, the USDJPY chart is showing some signs of fatigue in the upward momentum.
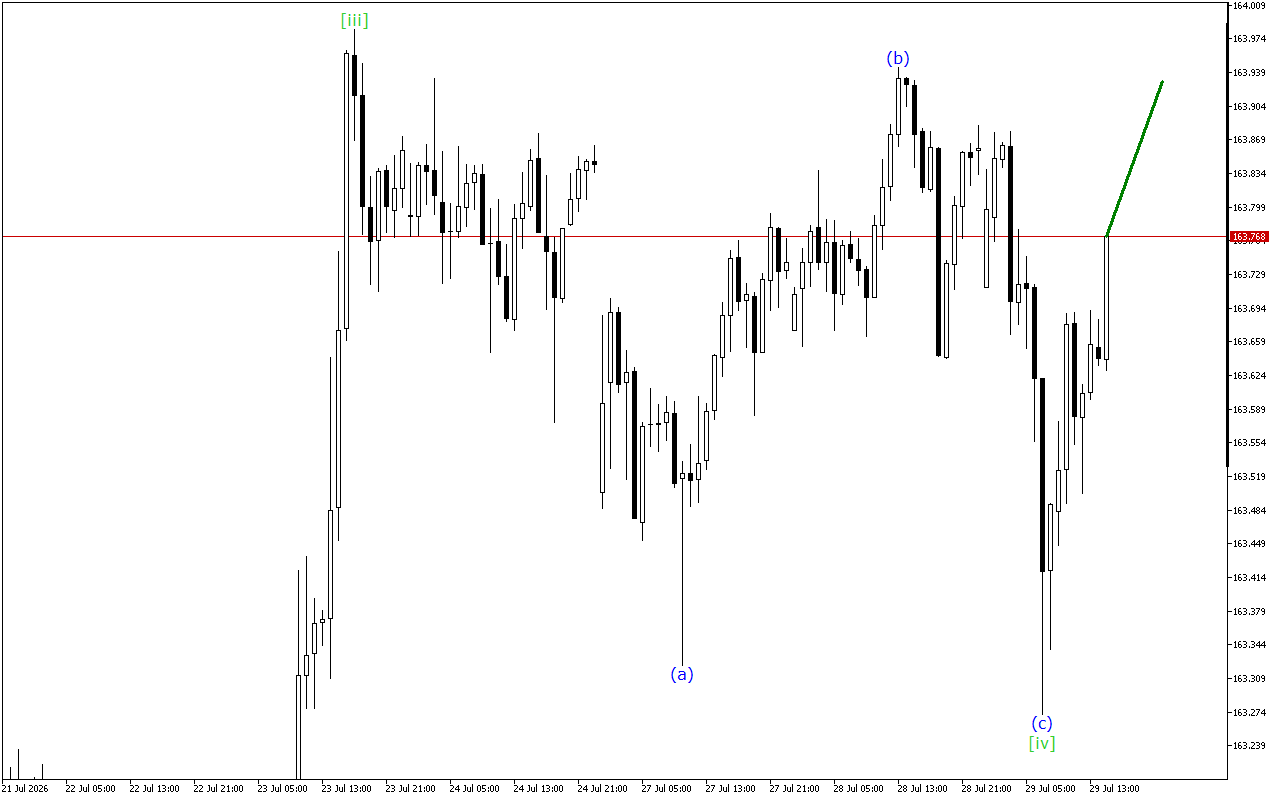
The analysis of the wave structure indicates the development of an incomplete downward impulse. Currently, a corrective wave [iv] has been formed, which is followed with the development of a downward wave [v].
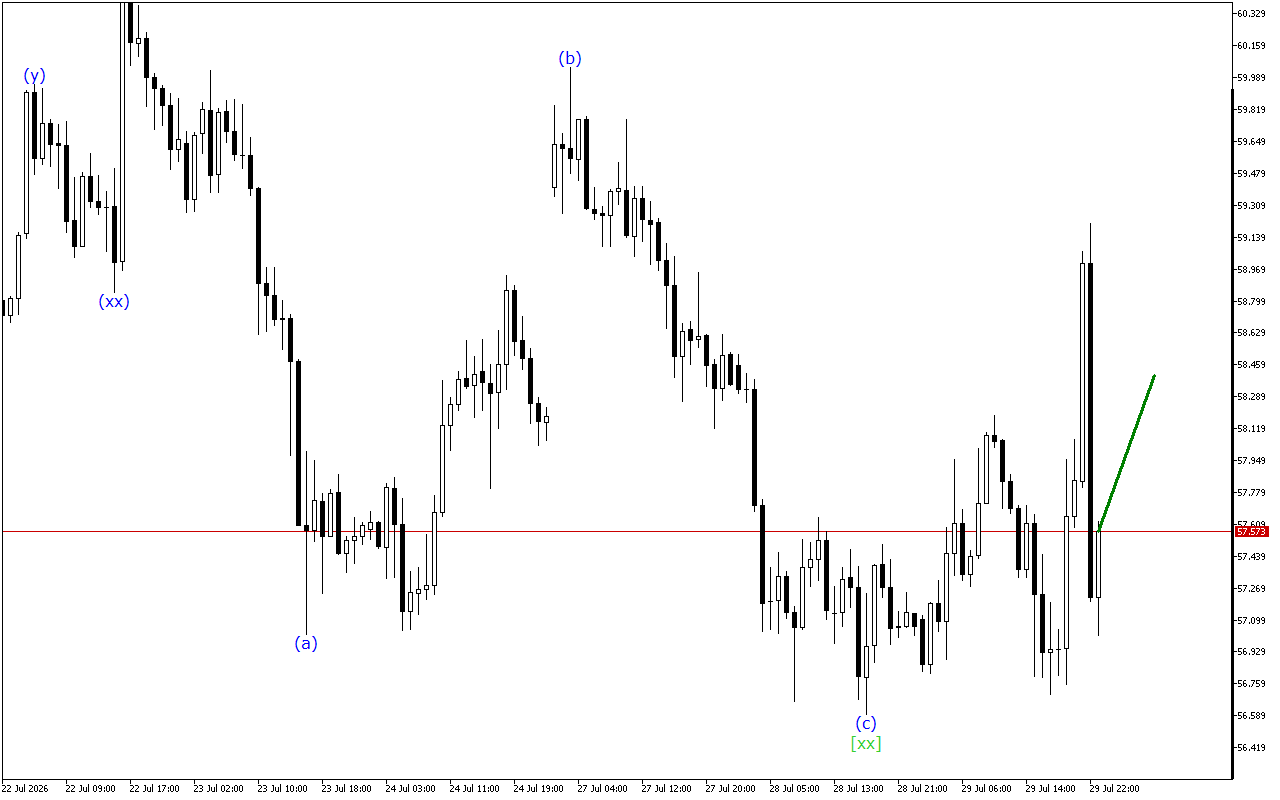
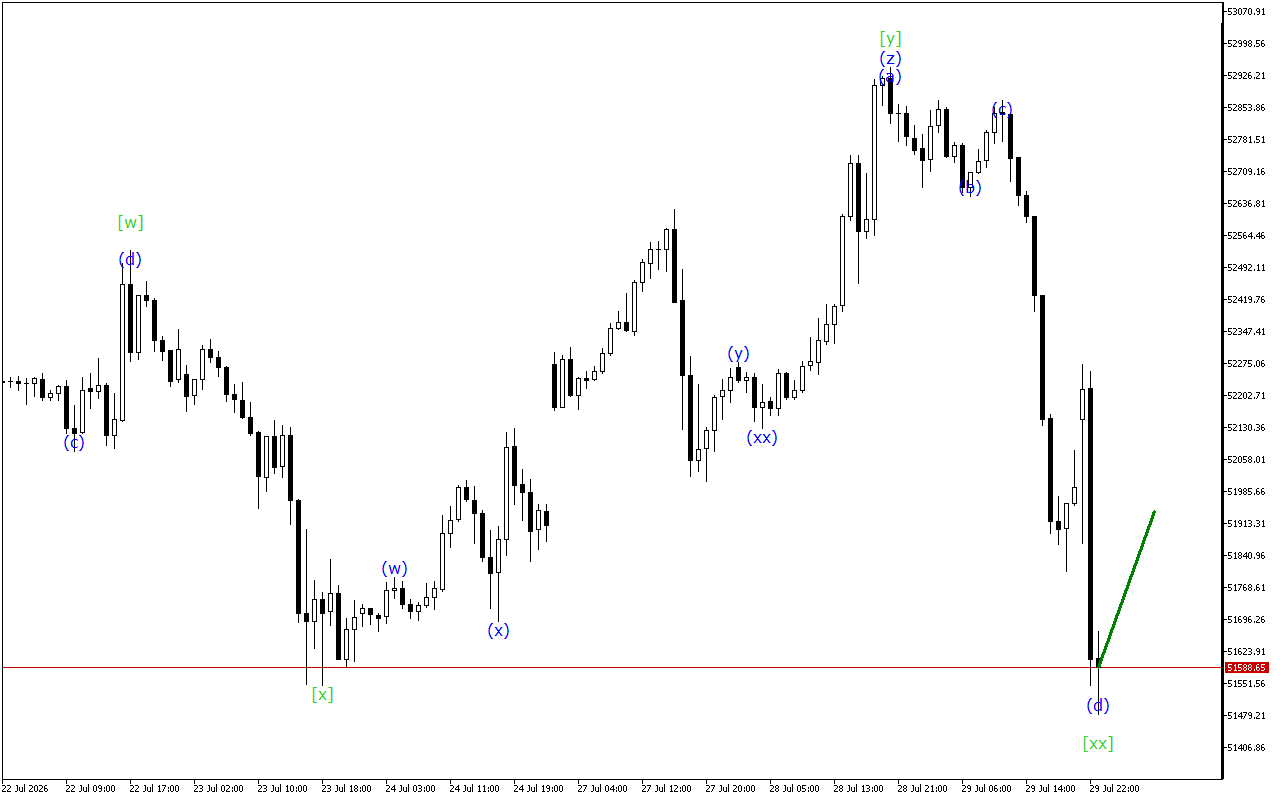
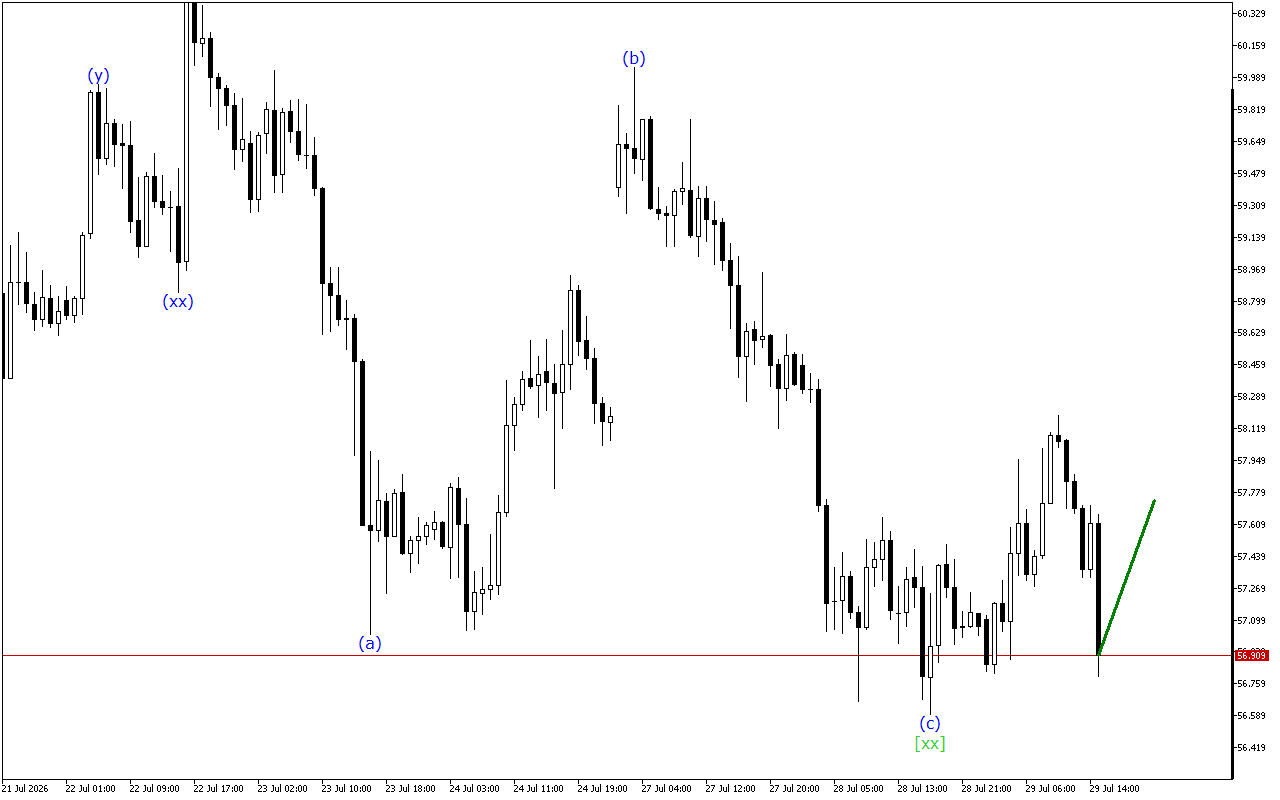
In the context of the lower-degree wave structure, the formation of the ABC zigzag is clearly seen. Once the wave (c) is fully formed, a resumption of the trend movement may be observed.
Thus, an upward movement continues to form on the USDJPY chart, but this impulse is at the final stage of formation so the price may resume a downward movement.
In this case, the emphasis is on short positions that can be considered at current levels.
Alternative scenario
Long positions should be looked for after the breakout of the top of the current wave.
USDJPY H1: Wave Analysis for the European Session on 2.2.2026
Related Posts
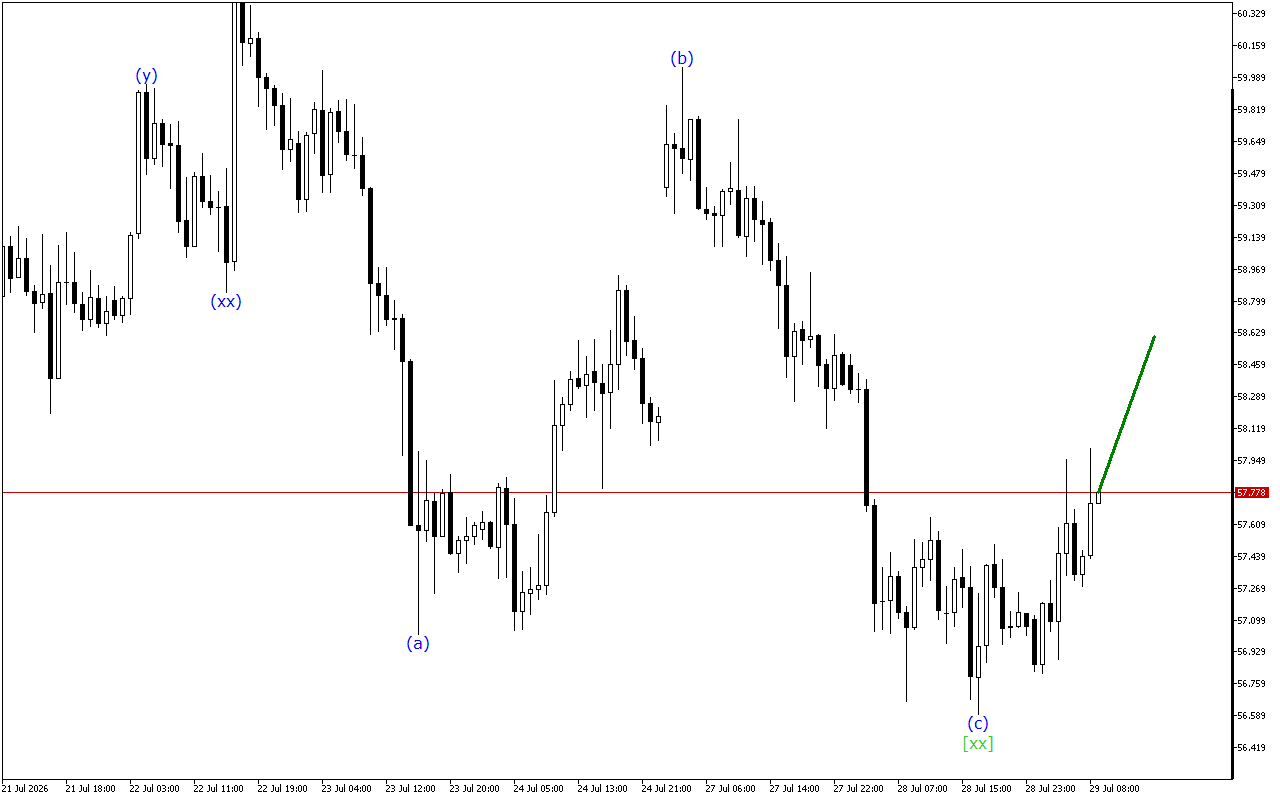
XAGUSD H1: Wave Analysis for the Asian Session on 30.7.2026
Despite the steady decline in price, the XAGUSD chart is giving signals about a possible completion of the current bearish momentum.XAGUSD continues to move within the Triple Three wave structure.…
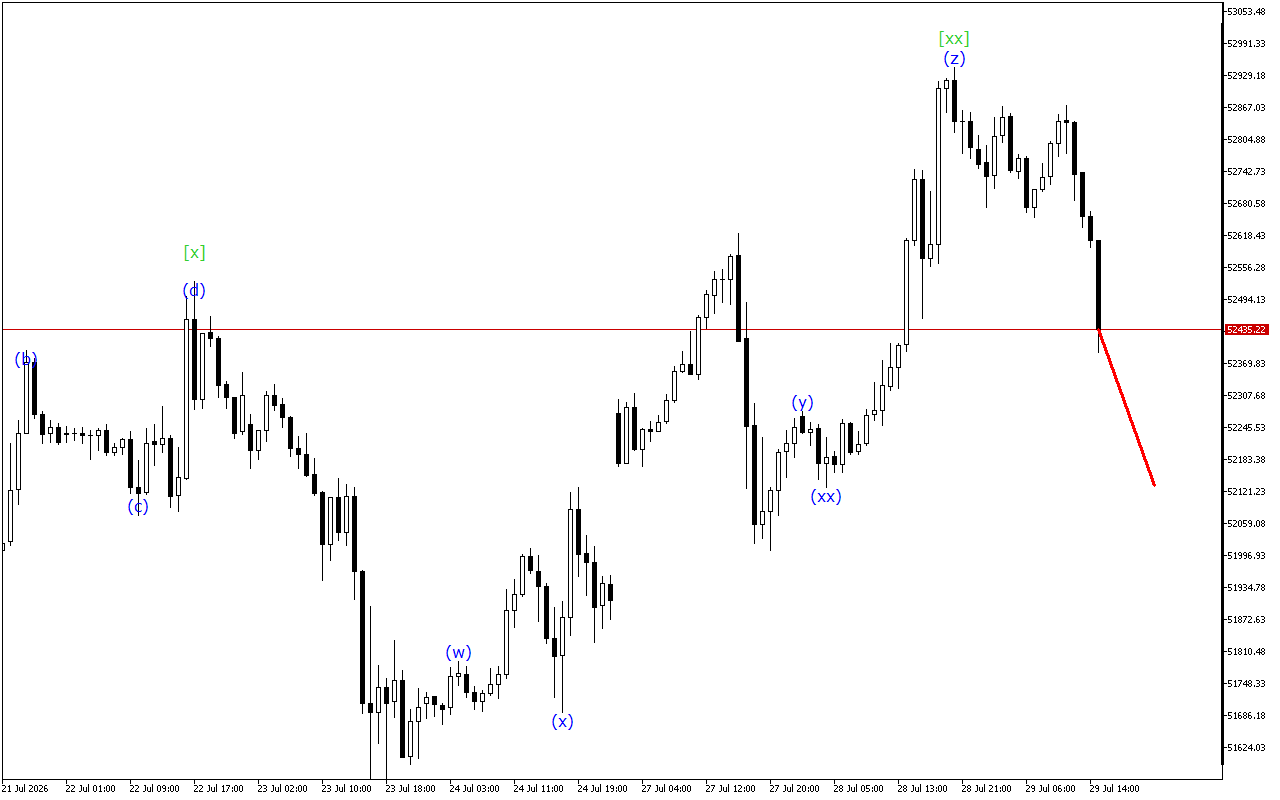
Dow Jones H1: Wave Analysis for the Asian Session on 30.7.2026
The market is still heading down, but the chart shows signs that the current trend will end soon.The medium-term movement vector of Dow Jones indicates the formation of a Triple…