

The market is still heading down, but the chart shows signs that the current trend will end soon.
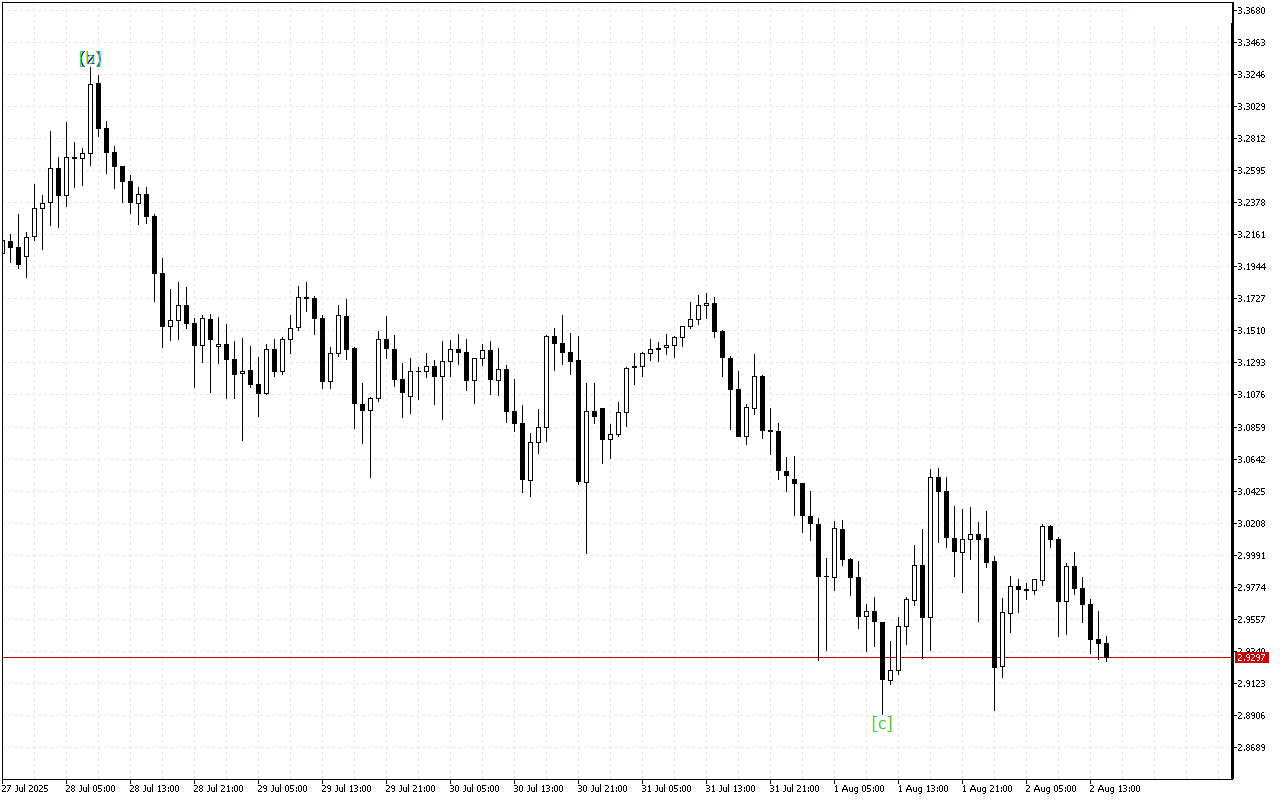
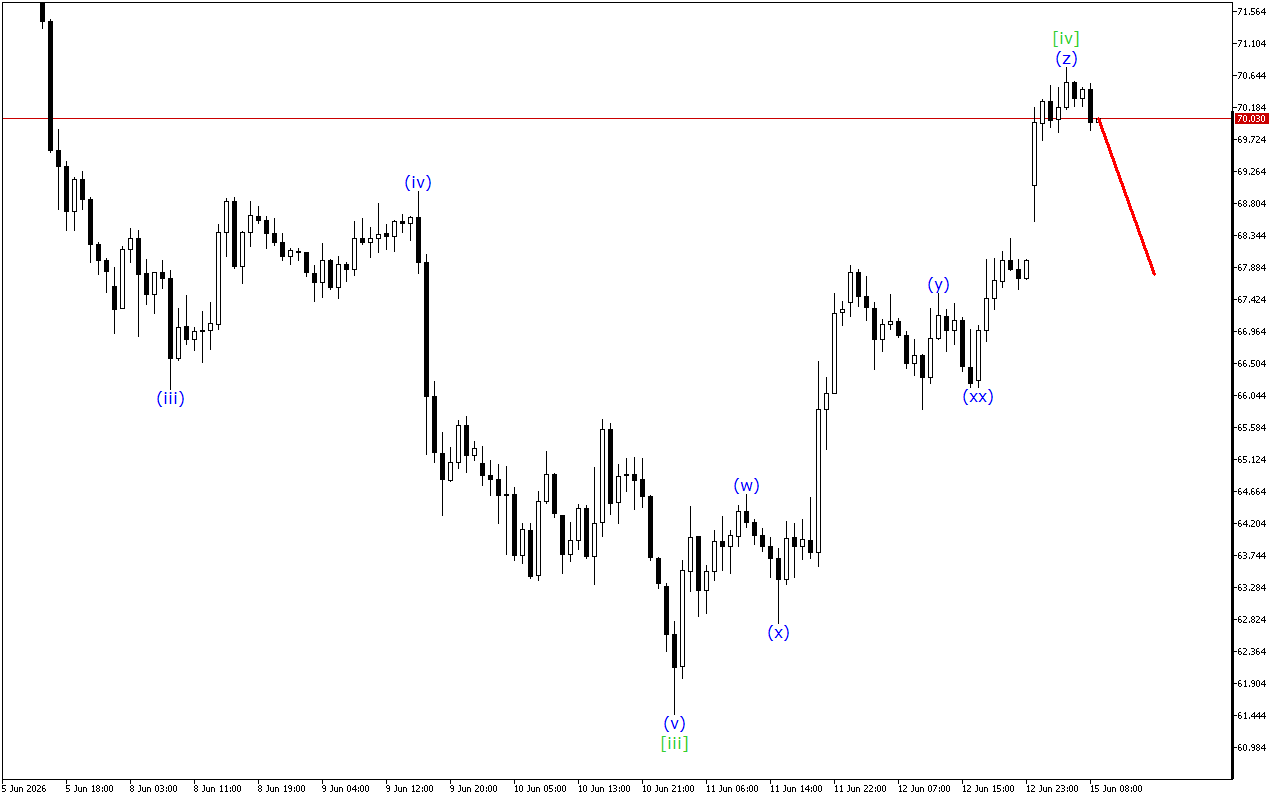
The wave structure of the higher time interval indicates the formation of a corrective movement in the form of an ABC zigzag. Now there is a final wave [c].
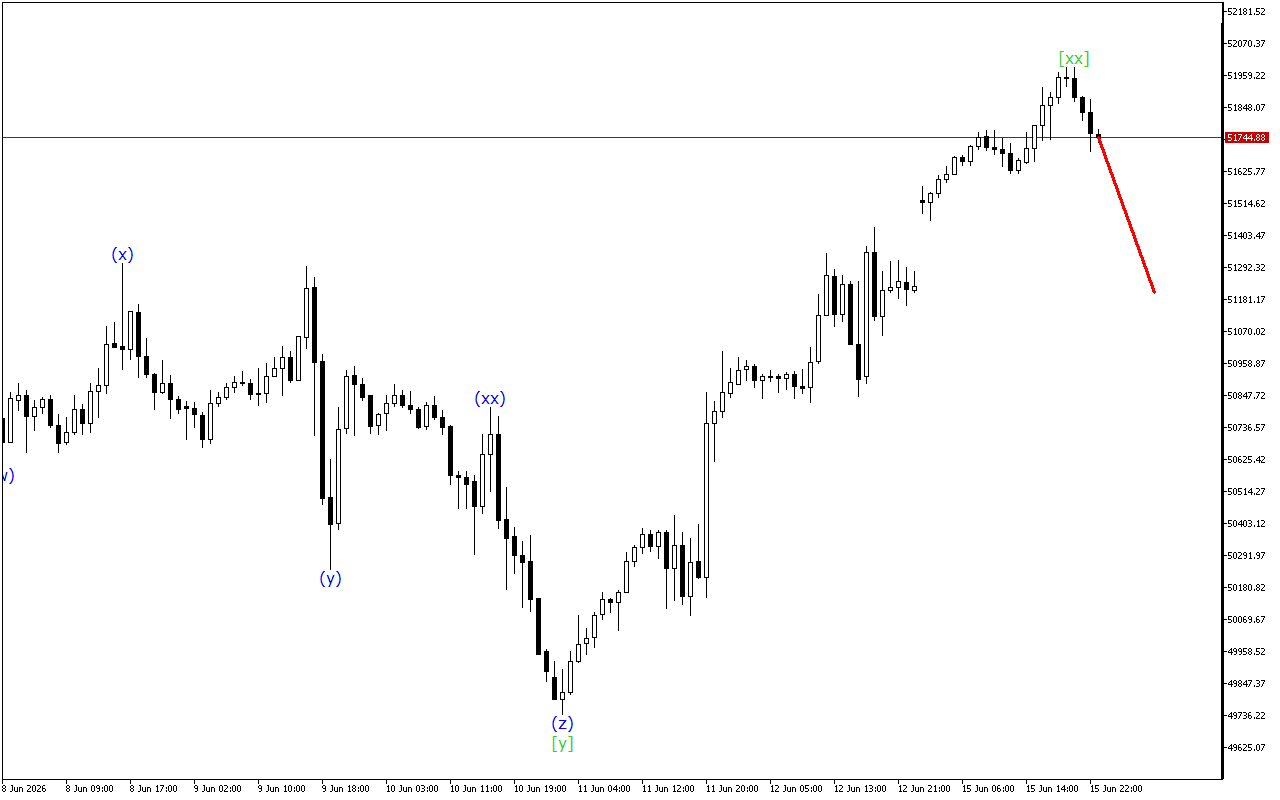
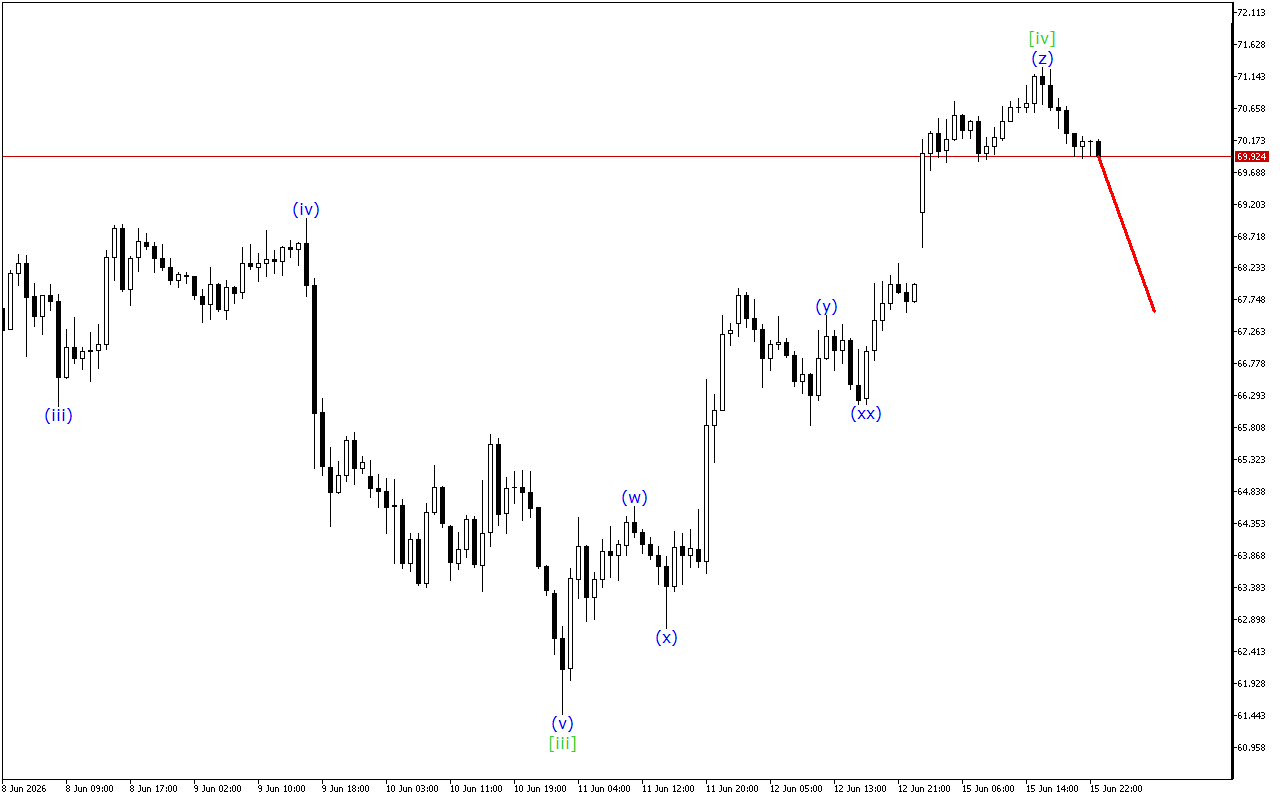
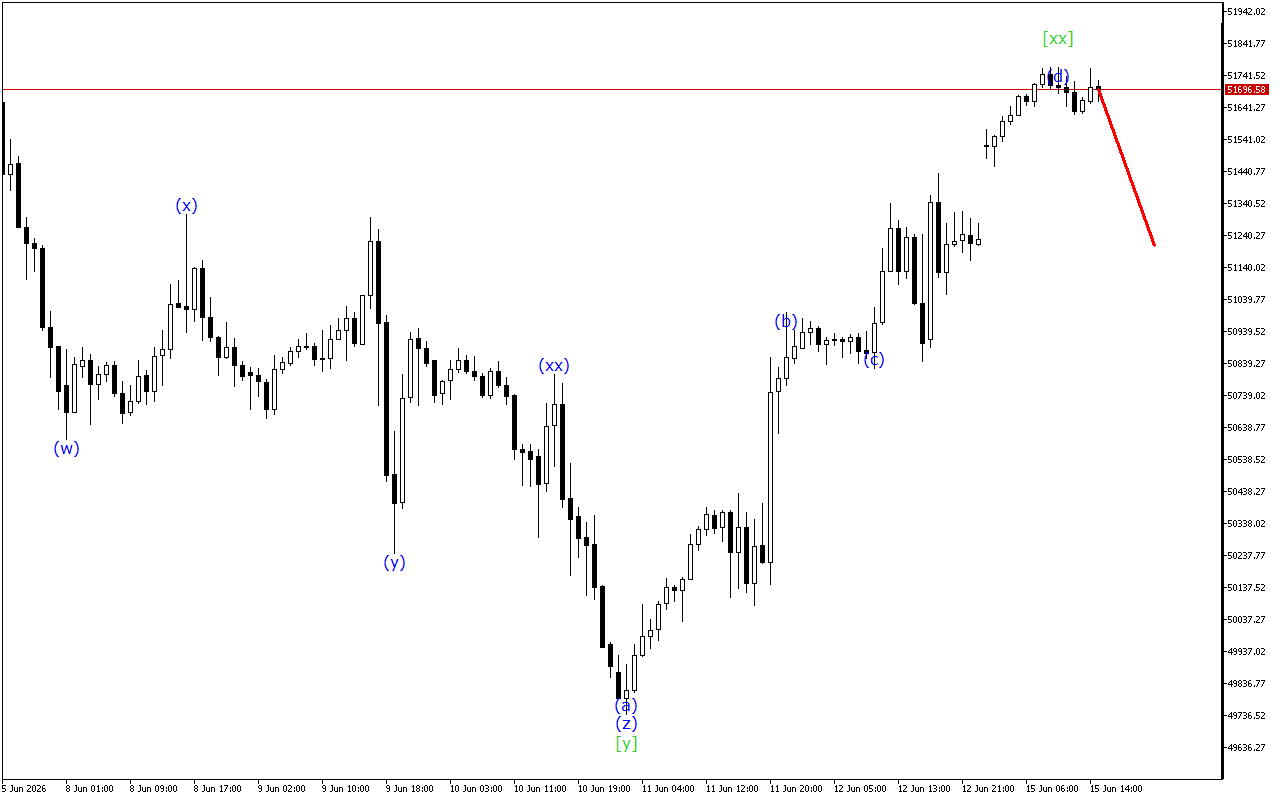
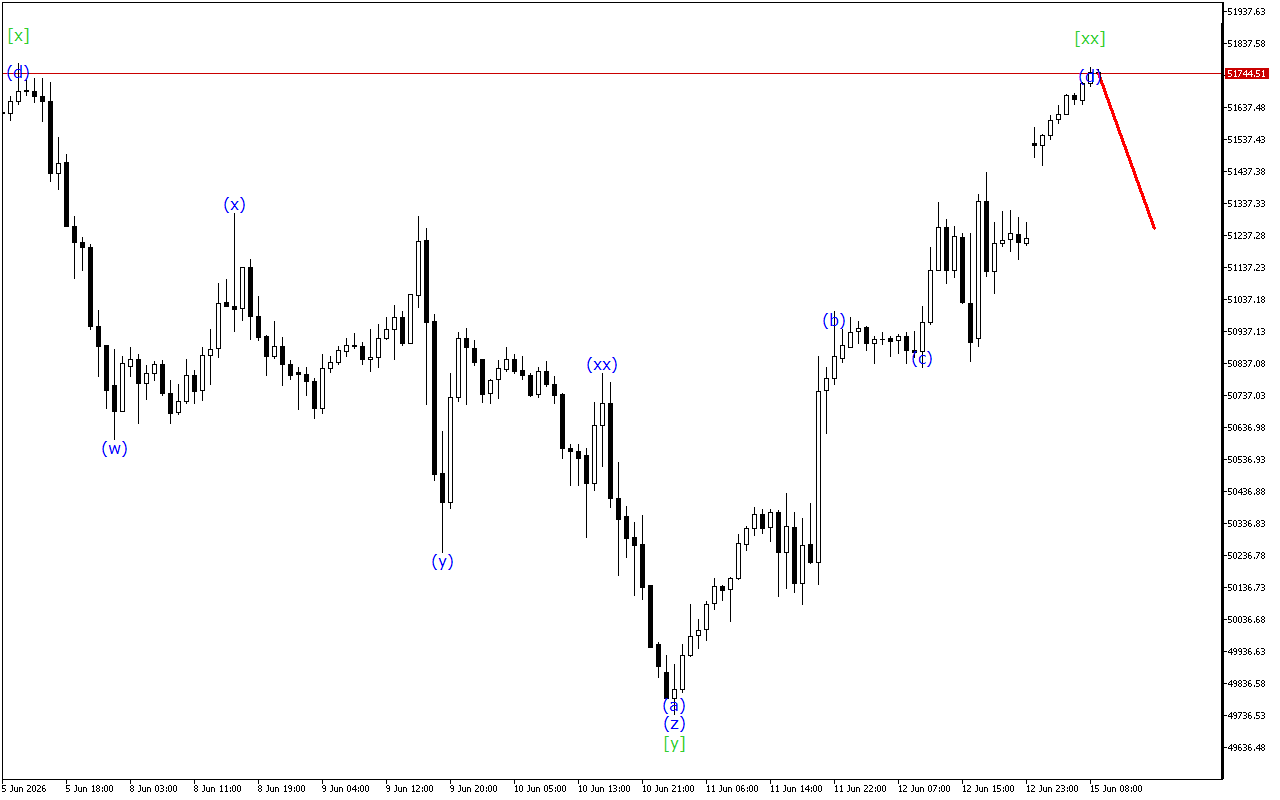
At a lower-degree wave structure, the formation of a triple three is noted. Now the price is in the wave (z), which completes this formation. This wave is expected to end in the near future. After that the current price trend may change.
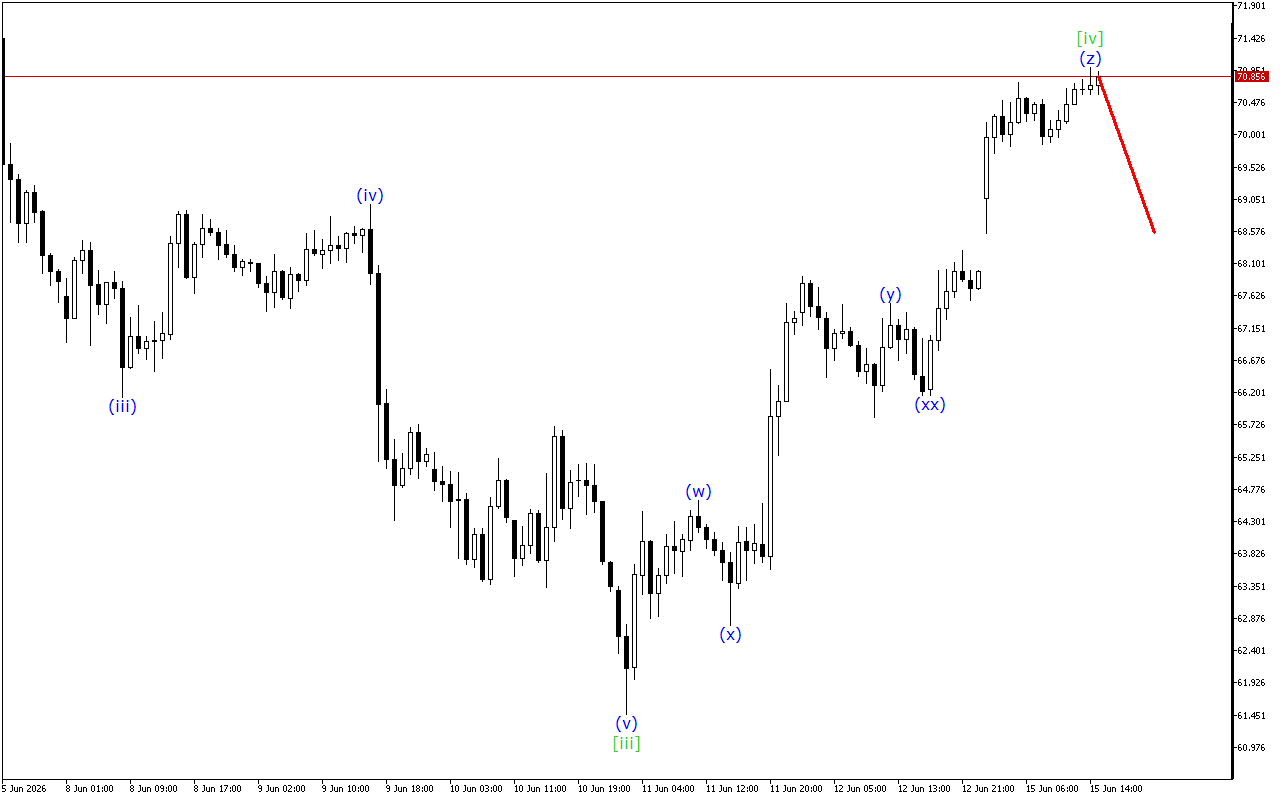
As a result, the formation of a downward movement continues on the chart. However, a wave structure is almost formed and the price may change the direction of movement.
In this situation, it should be emphasized that short positions remain preferable.