

Although the market maintains an upward momentum prevalence, the Dow Jones chart shows signs of a possible end to this trend.
The analysis of the higher degree wave structure shows a falling wedge. Within this five-wave formation, the formation of the wave [iv] is completed and the resumption of downward movement within the wave [v] is expected.
Within a lower-degree wave structure, the development of a triple three is noted. The formation of the wave (z) is being completed in this structure. Against this background, the completion of correction and the beginning of a more directional movement are expected.
Thus, an upward movement continues to form on the Dow Jones chart, but this impulse is at the final stage of formation so the price may resume a downward movement.
In this case, the emphasis is on short positions that can be considered at current levels.
Dow Jones H1: Wave Analysis for the European Session on 21.7.2025
Related Posts
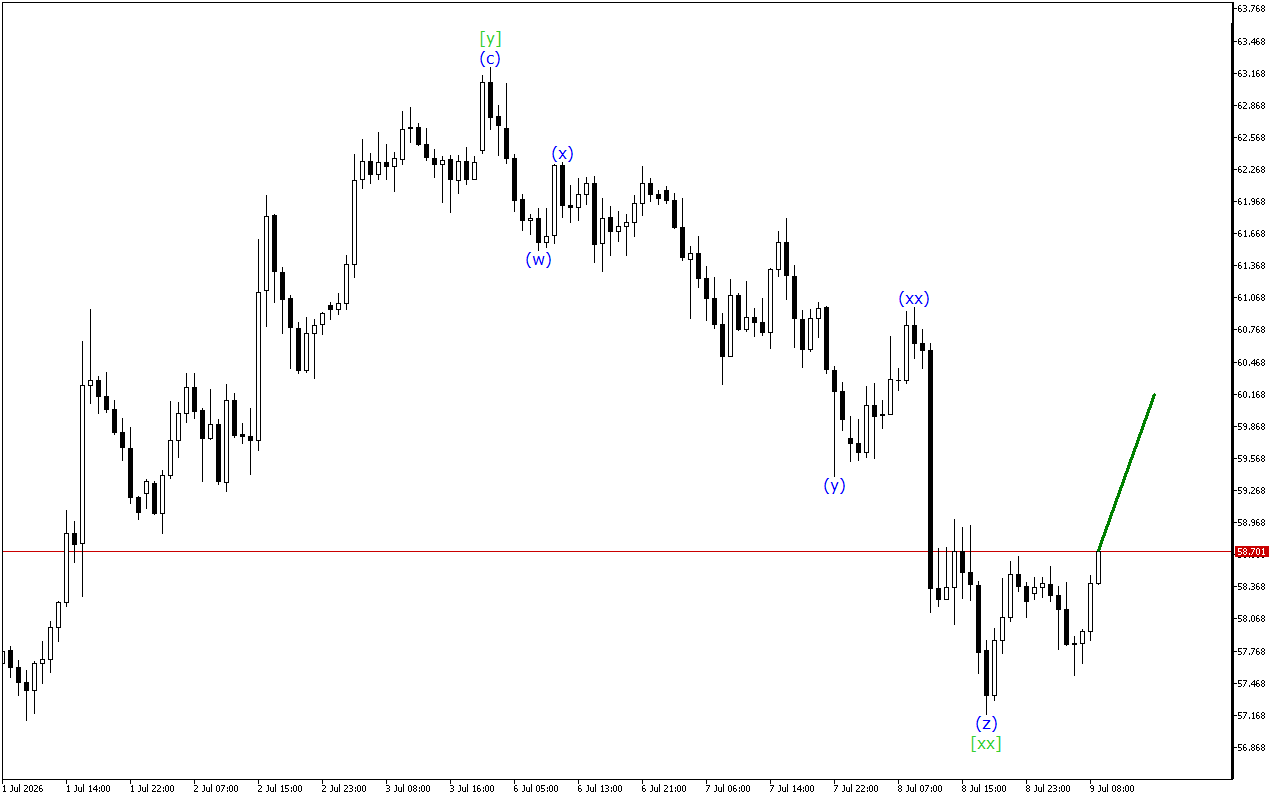
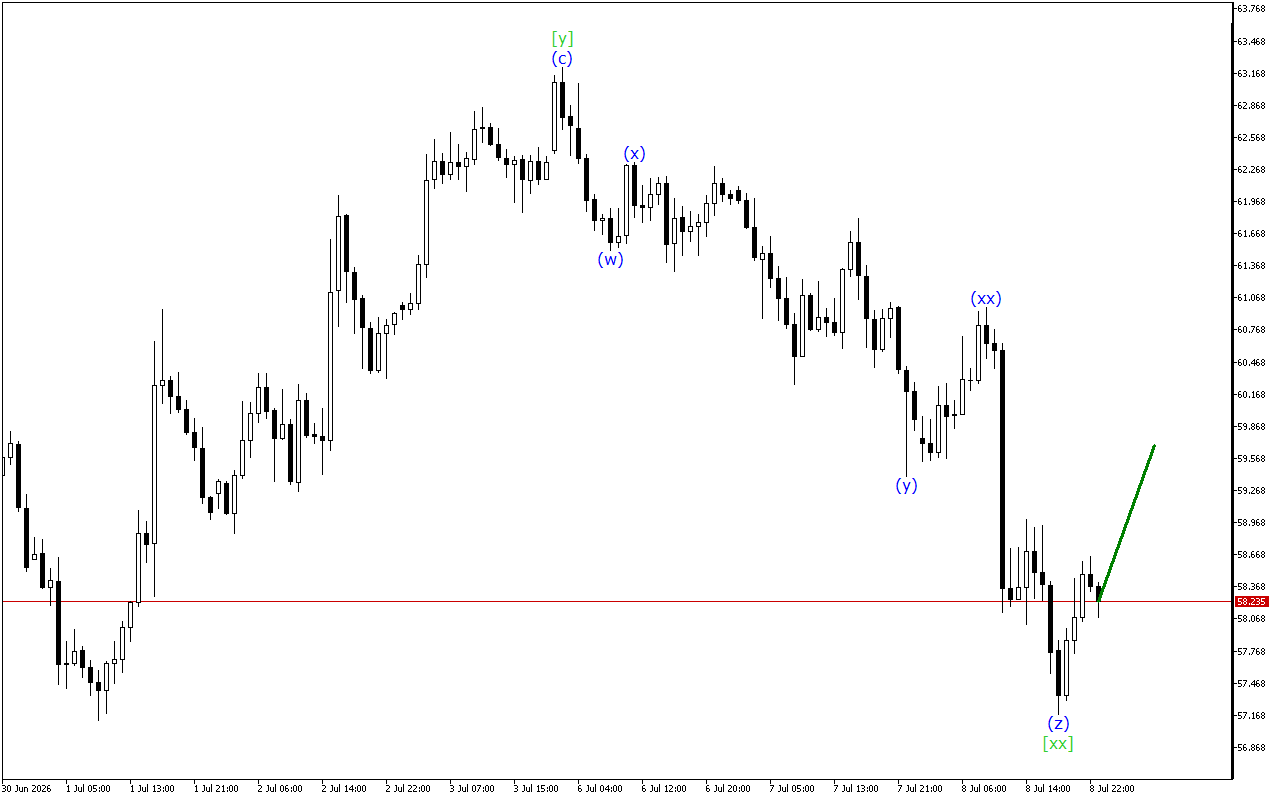
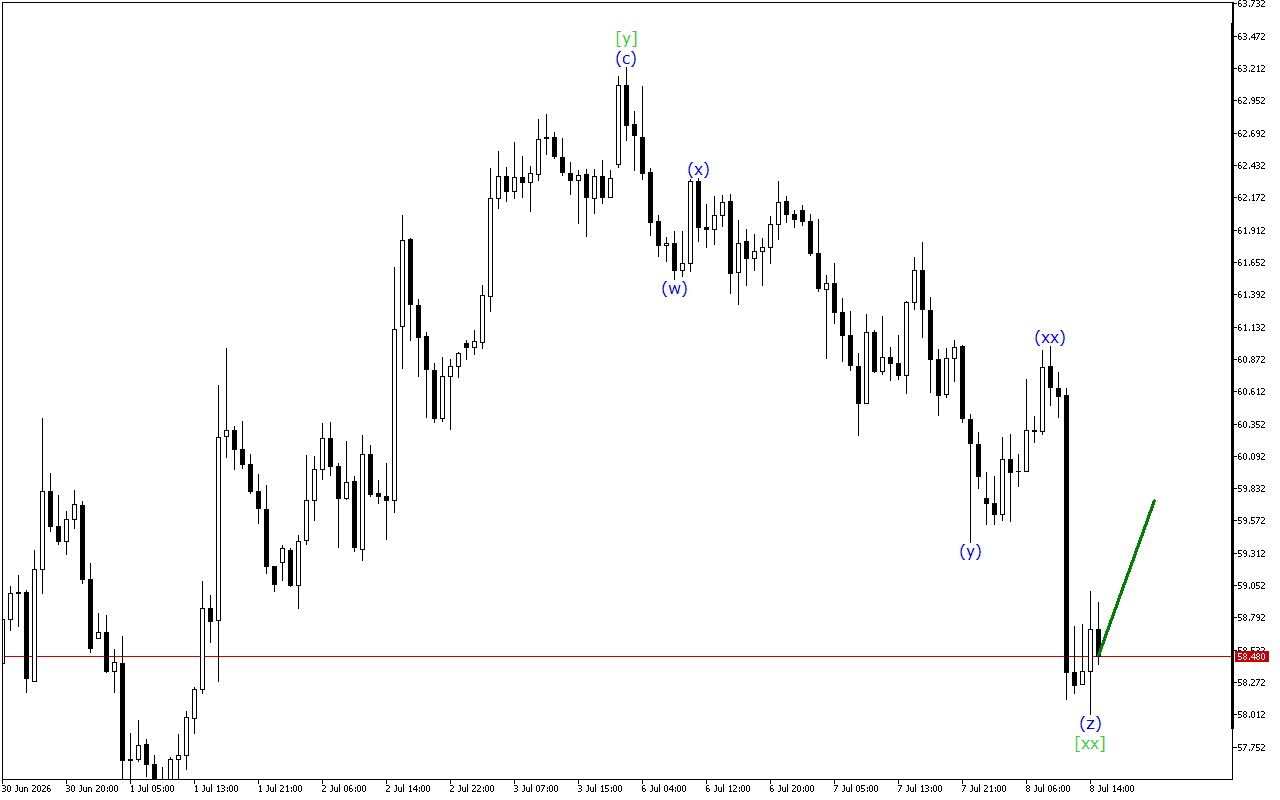
XAGUSD H1: Wave Analysis for the European Session on 9.7.2026
Despite the steady decline in price, the XAGUSD chart is giving signals about a possible completion of the current bearish momentum.The medium-term movement vector of XAGUSD indicates the formation of…
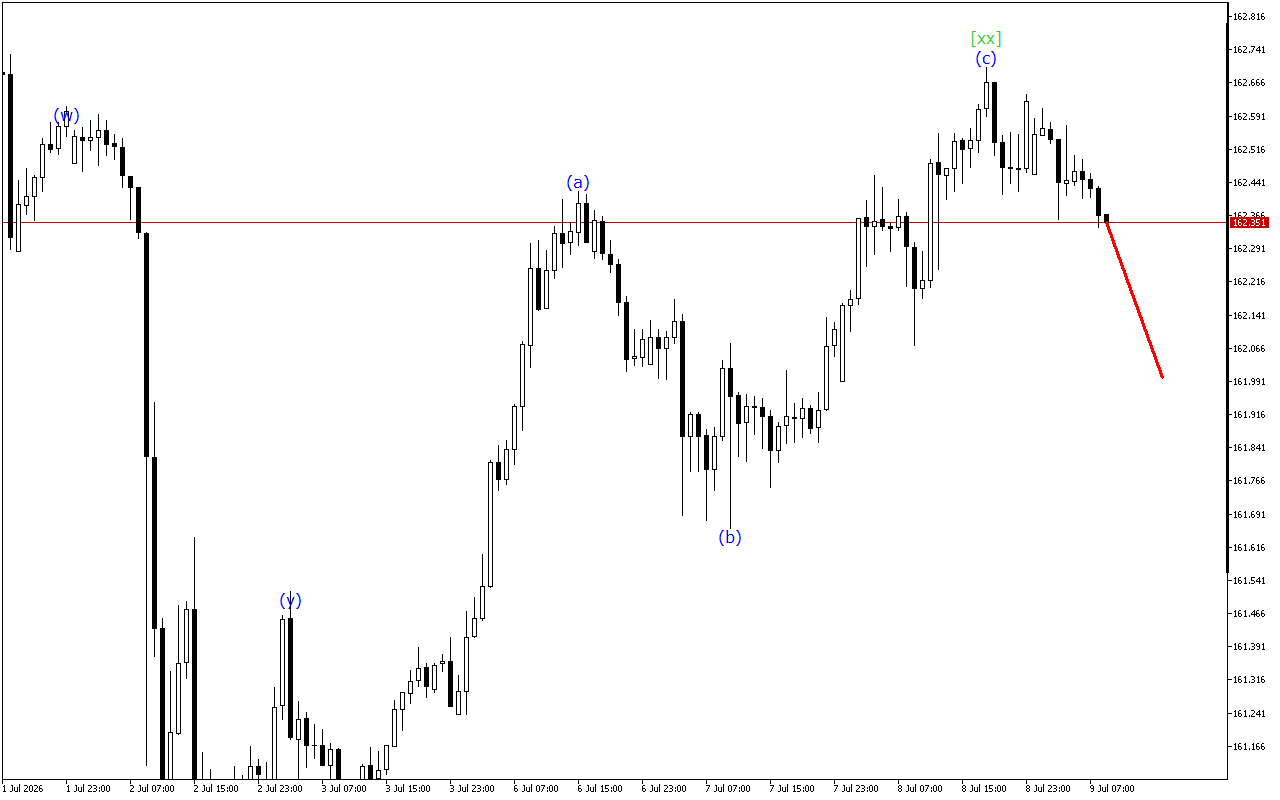
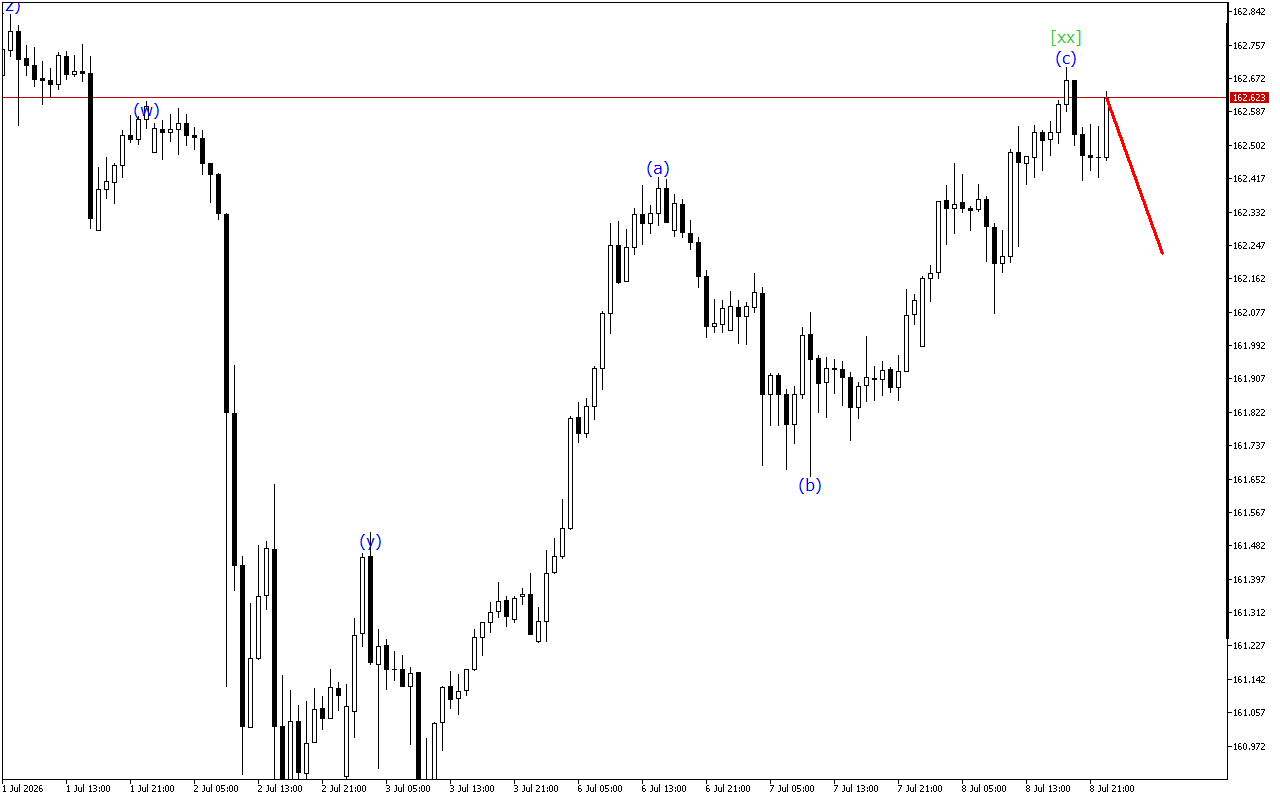
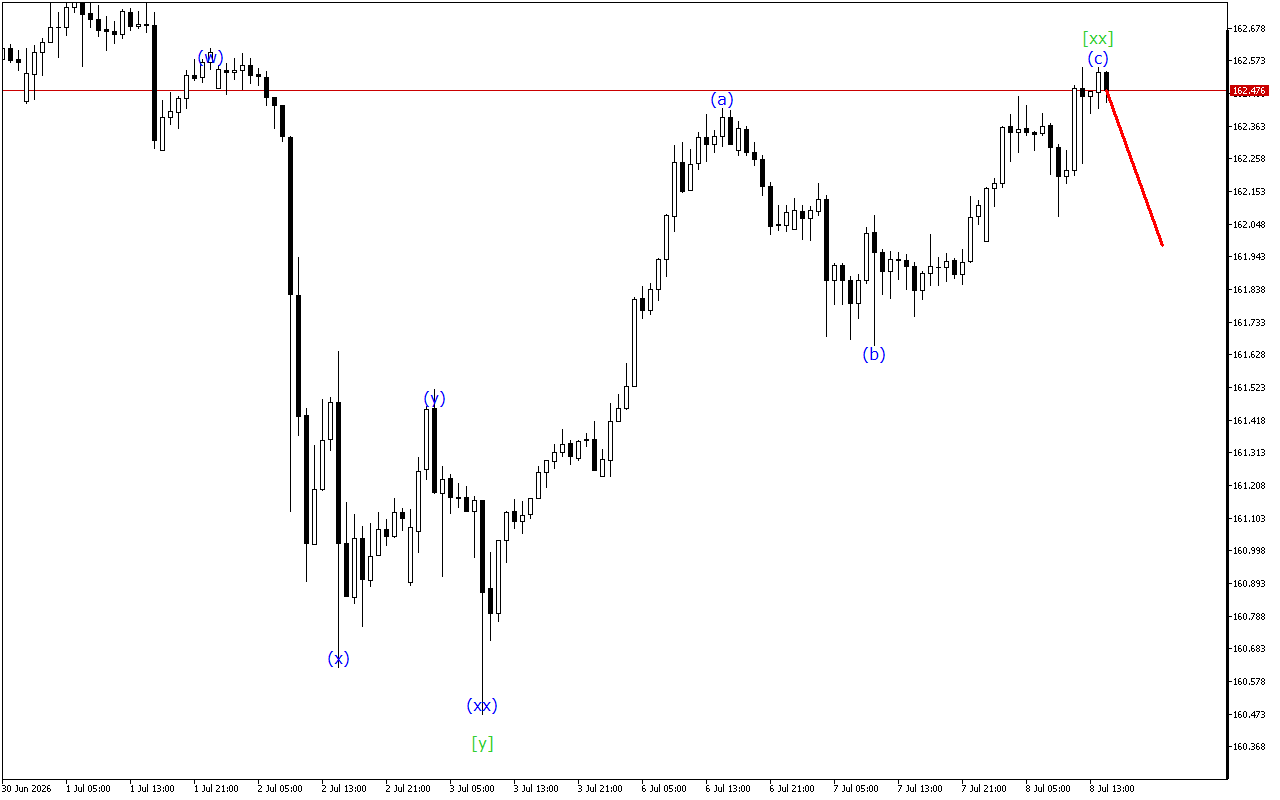
USDJPY H1: Wave Analysis for the European Session on 9.7.2026
The price continues to move upward, but on the USDJPY chart you can see signs of an impending completion of the current upward momentum.There is the development of a triple…