

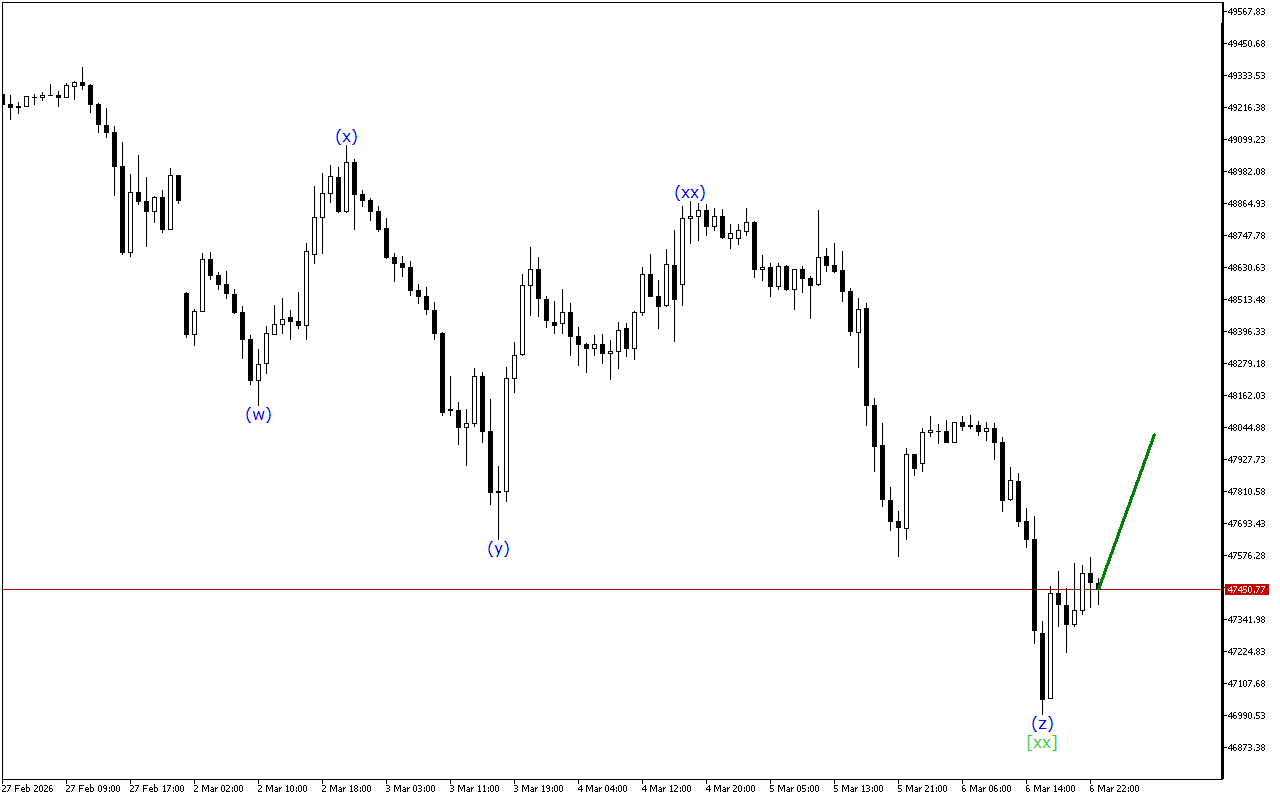
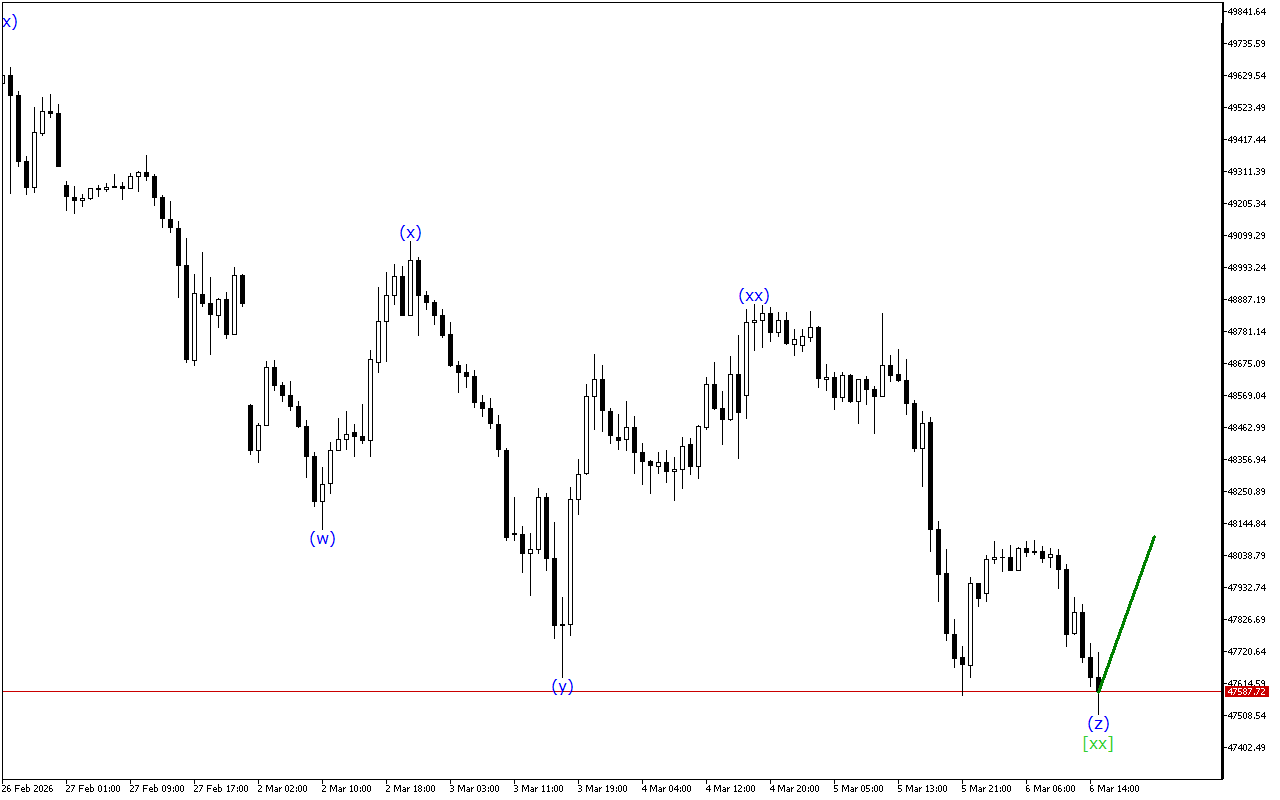
Although the market maintains an upward momentum prevalence, the Dow Jones chart shows signs of a possible end to this trend.
The current dynamics of the movement indicate the formation of a triple three. At the moment, the wave [xx] has been formed. After its formation the development of a downward wave [z] is expected.
In the context of the lower-degree wave structure, the formation of the ABC zigzag is clearly seen. Once the wave (c) is fully formed, a resumption of the trend movement may be observed.
Thus, an upward movement continues to form on the Dow Jones chart, but this impulse is at the final stage of formation so the price may resume a downward movement.
In this case, the emphasis is on short positions that can be considered at current levels.
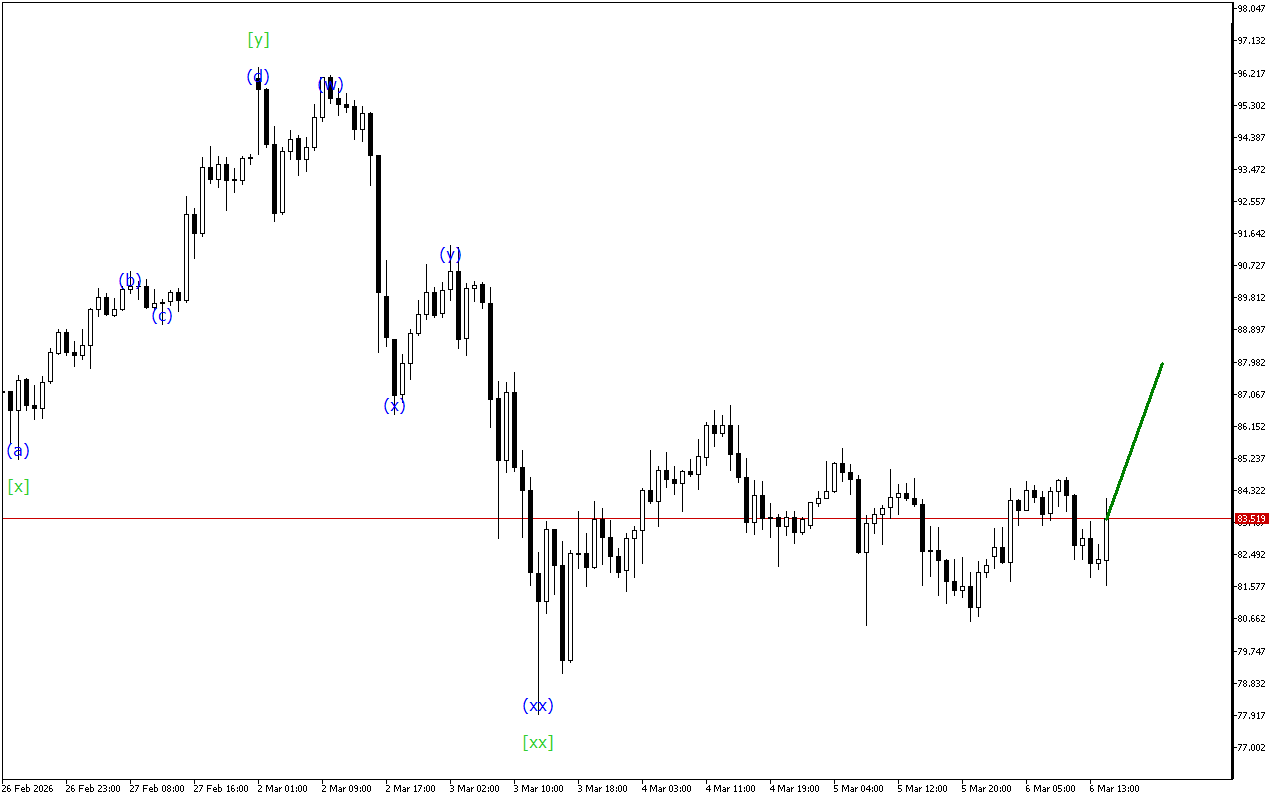
Альтернативный сценарий
Dow Jones H1: Wave Analysis for the European Session on 13.1.2026
Related Posts
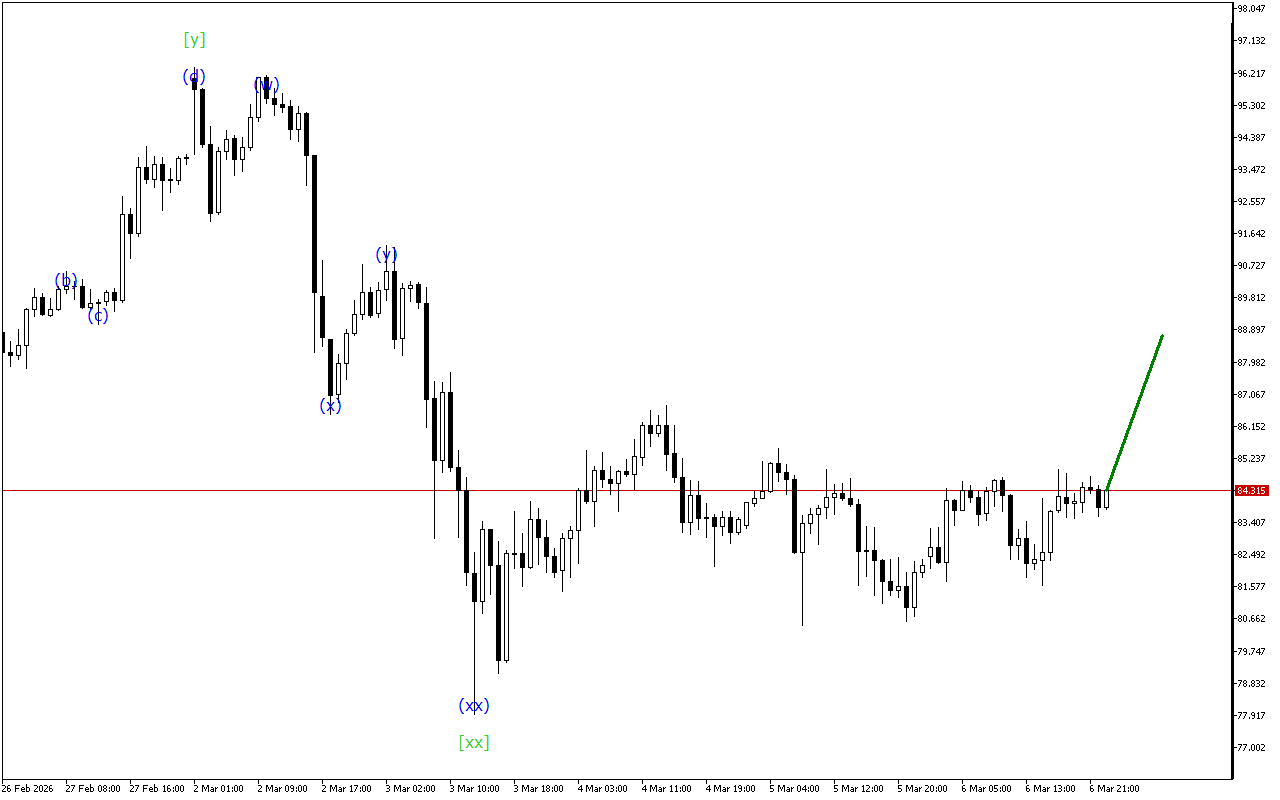
XAGUSD H1: Хвильовий аналіз для азіатської сесії 9.3.2026
Незважаючи на падіння, на графіку XAGUSD є сигнали, які вказують на можливу зміну напрямку в майбутньому.XAGUSD продовжує рухатися в структурі хвилі “Потрійної Трійки“. Зараз, мабуть, на графіку завершилося формування хвилі…
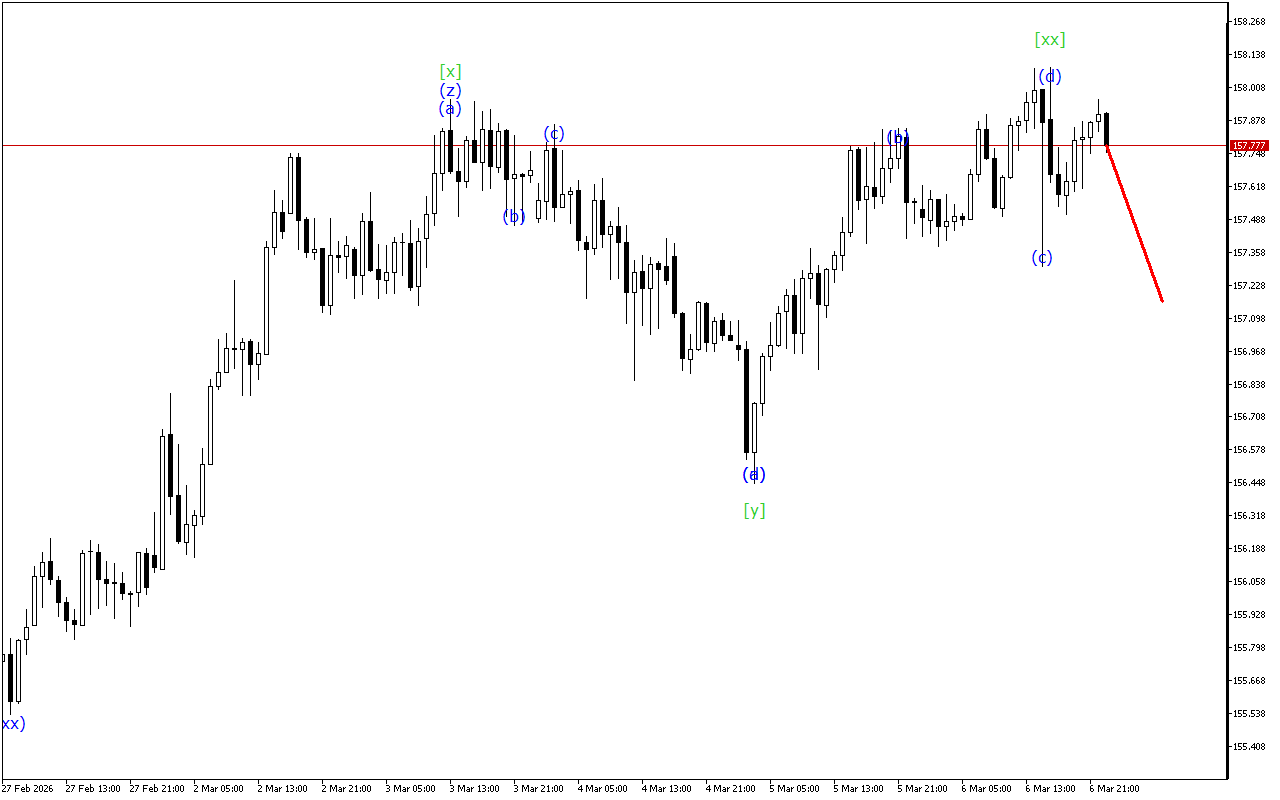
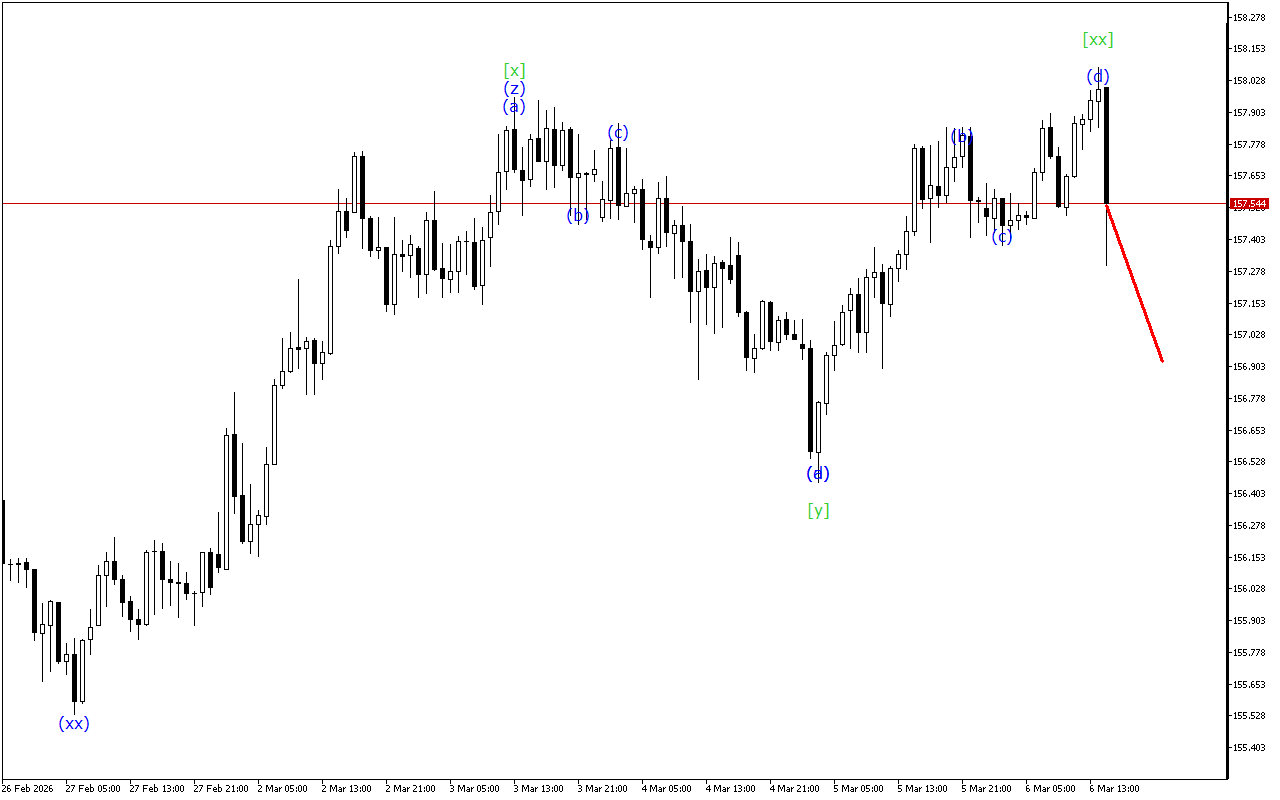
USDJPY H1: Хвильовий аналіз для азіатської сесії 9.3.2026
Графік USDJPY показує сигнали про закінчення висхідного імпульсу.Сучасна динаміка руху свідчить про формування потрійної трійки. На даний момент сформована хвиля [xx]. Після його формування очікується розвиток спадної хвилі [z].У контексті…